Expressions in QGIS have a lot of power and are used in many core
features -selection, calculating field values, styling, labelling etc.
QGIS also has support for user-defined expressions. With a little bit of
python programming, you can define your own functions that can be used
within the expression engine.
This tutorial is based on “QGIS Tutorials and Tips
v1.0” by Ujaval Gandhi, updated
to use Python 3 and QGis 3 by Ian Turton.
We will define a custom function that finds the UTM Zone of a map
feature and use this function to write an expression that displays the
UTM zone as a map tip when hovered over the point.
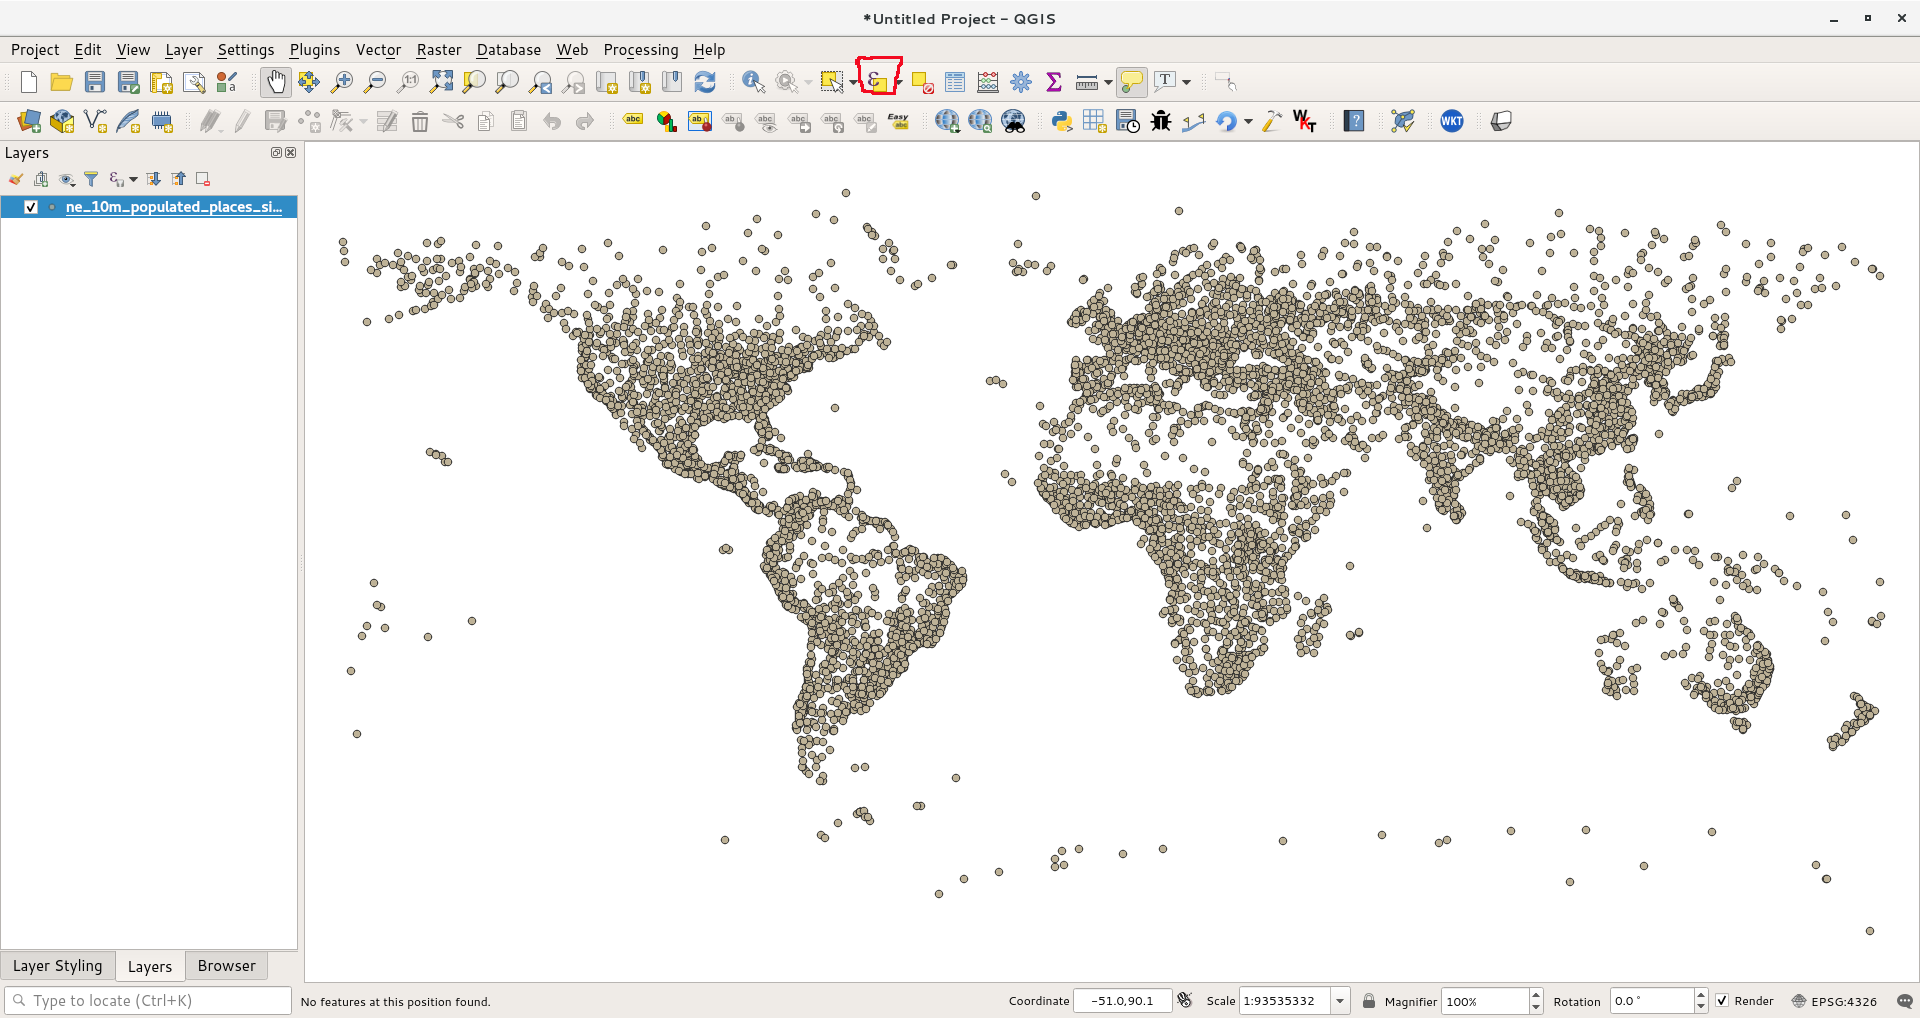
Open QGIS and go to Layers –> Add Vector –> Add Vector Layer. Or
browse to the downloaded ne_10m_populated_places_simple.zip file
and drag it into the map window.
Go to View –> Select –> Select By Expressions…. or click the
Ɛ icon:
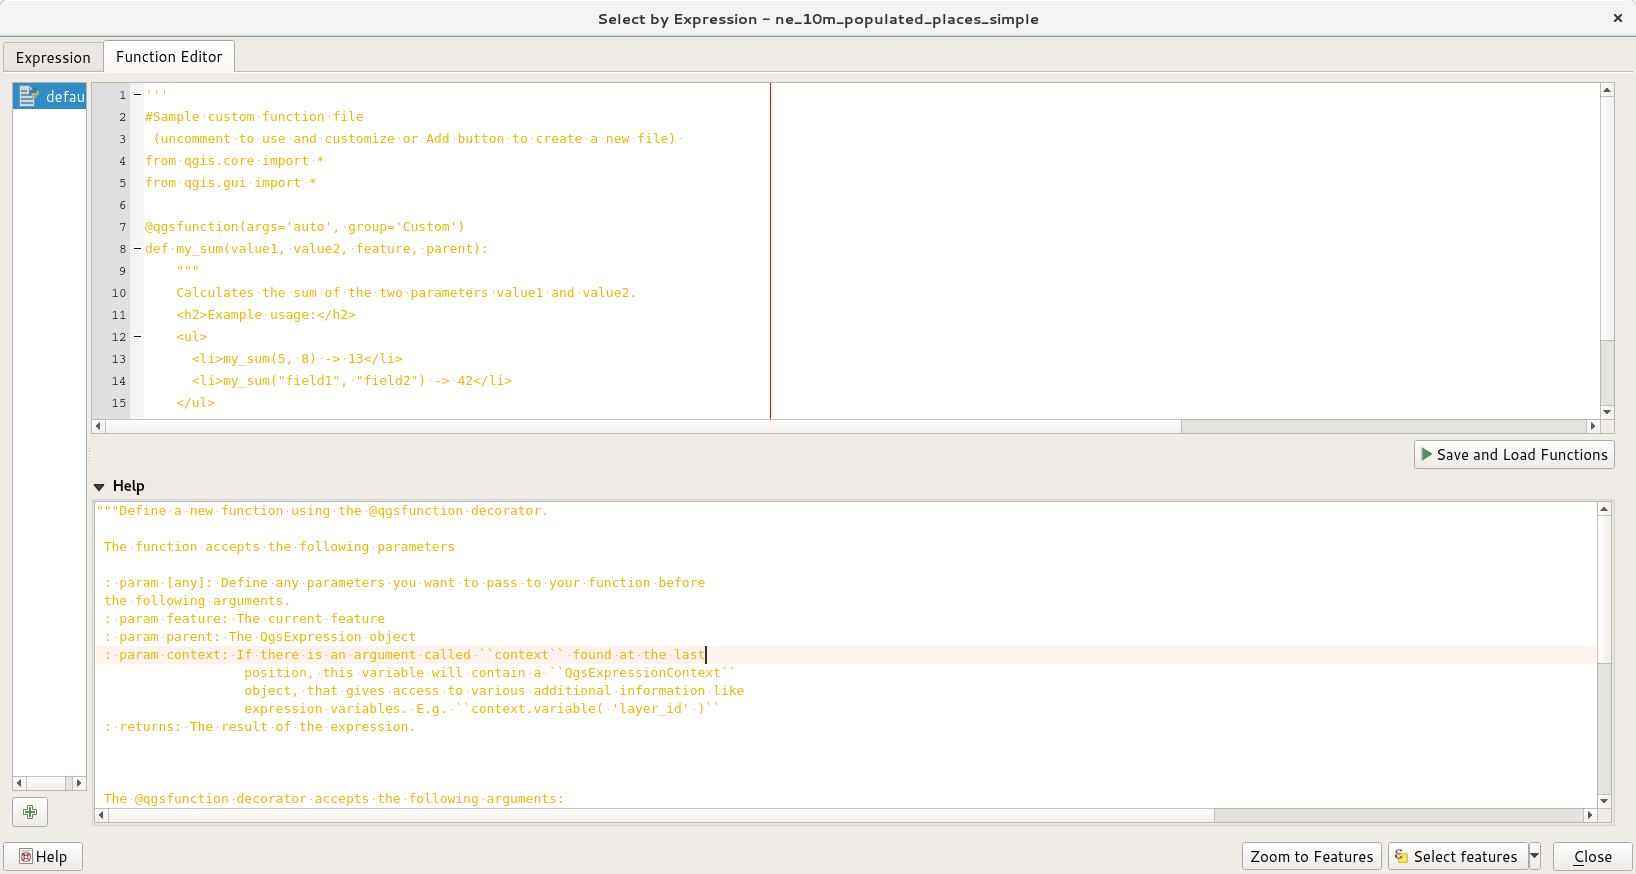
Switch to the Function Editor tab. Here you can write any PyQGIS
code that will be executed by the expression engine.
We will define a custom function named GetUtmZone that will
calculate the UTM zone number for each feature. Since custom
functions in QGIS work at the feature level. We will use the
centroid of the feature’s geometry and compute the UTM Zone from the
latitude and longitude of the centroid geometry. We will also add a
‘N’ or ‘S’ designation to the zone to indicate whether the zone is
in the northern or southern hemisphere.
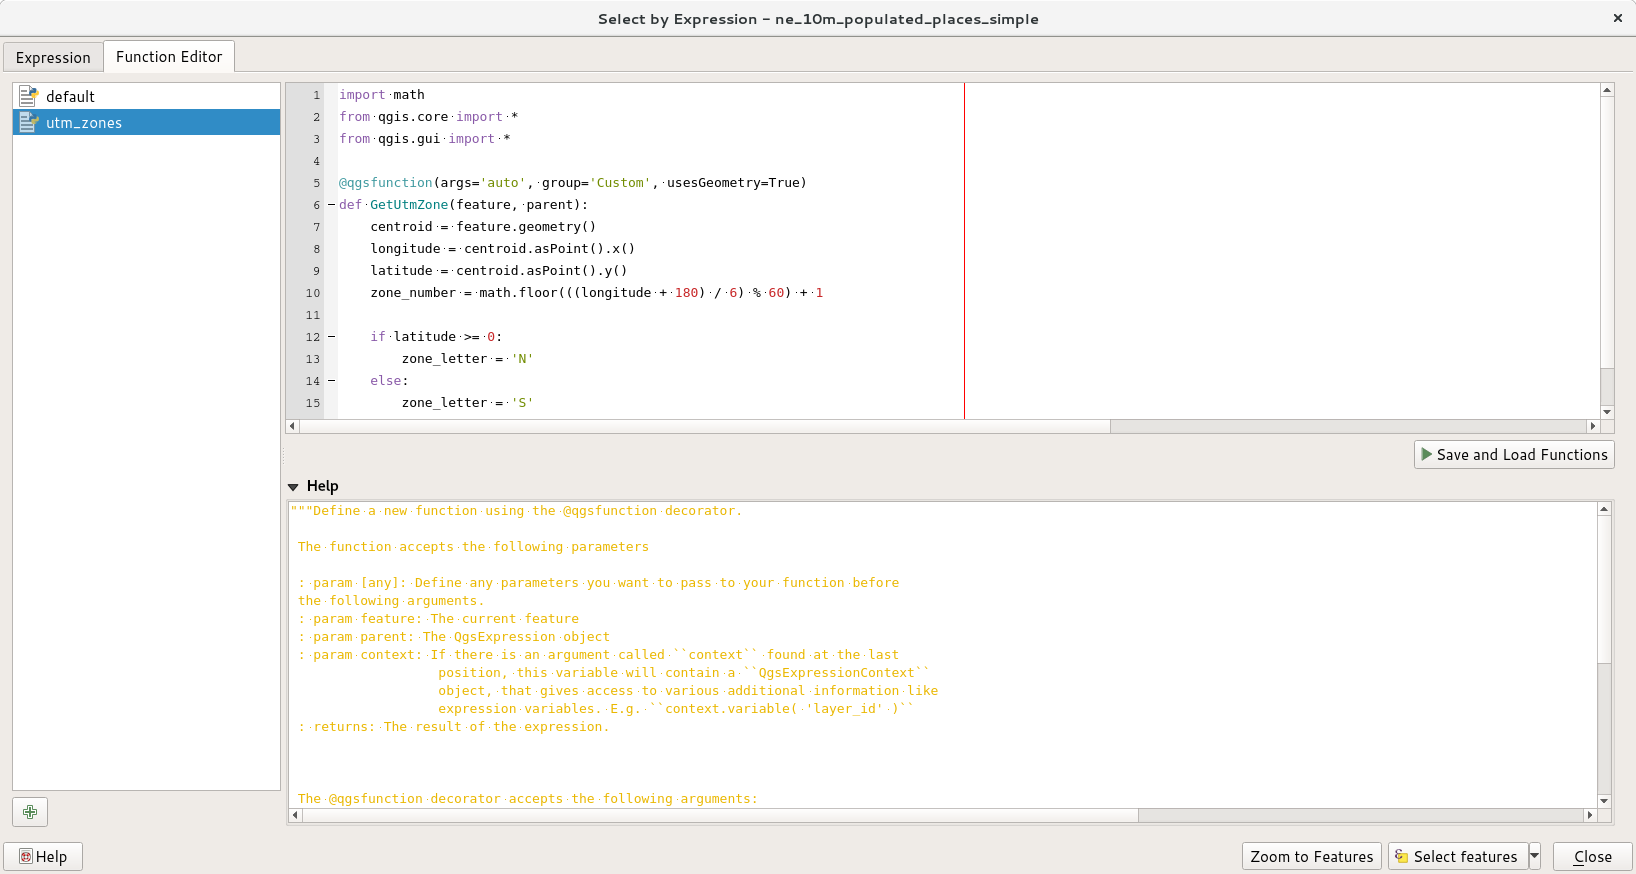
Press the plus button in the lower left of the screen and type
utm_zones.py as the file name. Then type the following code into
the editor window. When you are finished click
SaveandLoadFunctions (on the right).
Note
UTM Zones are longitudinal projection zones numbered from 1 to
60. Each UTM zone is 6 degree wide. Here we use a simple
mathematical formula to find the appropriate zone for a given
longitude value. Note that this formula doesn’t cover some
special UTM zones.
importmathfromqgis.coreimport*fromqgis.guiimport*@qgsfunction(args=0,group='Custom',usesgeometry=True)defGetUtmZone(value1,feature,parent):"""Return the UTM Zone of the feature's geometry as a String"""centroid=feature.geometry()longitude=centroid.asPoint().x()latitude=centroid.asPoint().y()zone_number=math.floor(((longitude+180)/6)%60)+1iflatitude>=0:zone_letter='N'else:zone_letter='S'return'%d%s'%(int(zone_number),zone_letter)
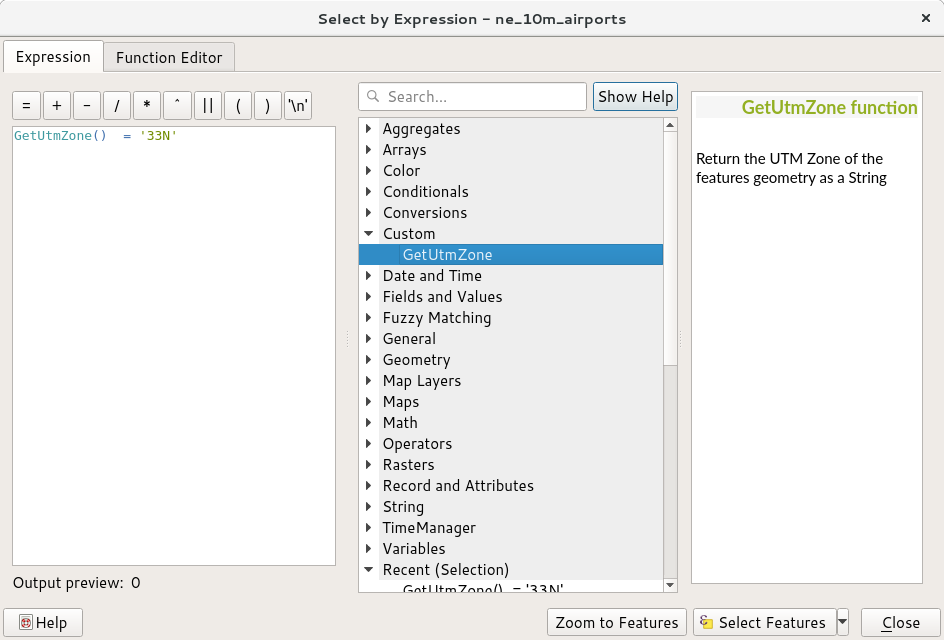
Switch to the Expression tab in the Select by expression dialog.
Find and expand the Custom group in the Functions section. You will
notice a new custom function GetUtmZone in the list. We can now
use this function in the expressions just like any other function.
Type the following expression in the editor. This expression will
select all points that fall in the UTM Zone 33N. Click
ZoomtoFeatures and the map will change, if you click
SelectFeatures you should see the points in UTM zone 33N change
colour to yellow.
Warning
Due to an issue
in QGIS3.4.4 this will not work! However it does work in
releases from QGIS3.4.5 and QGIS3.6.
GetUtmZone()='33'
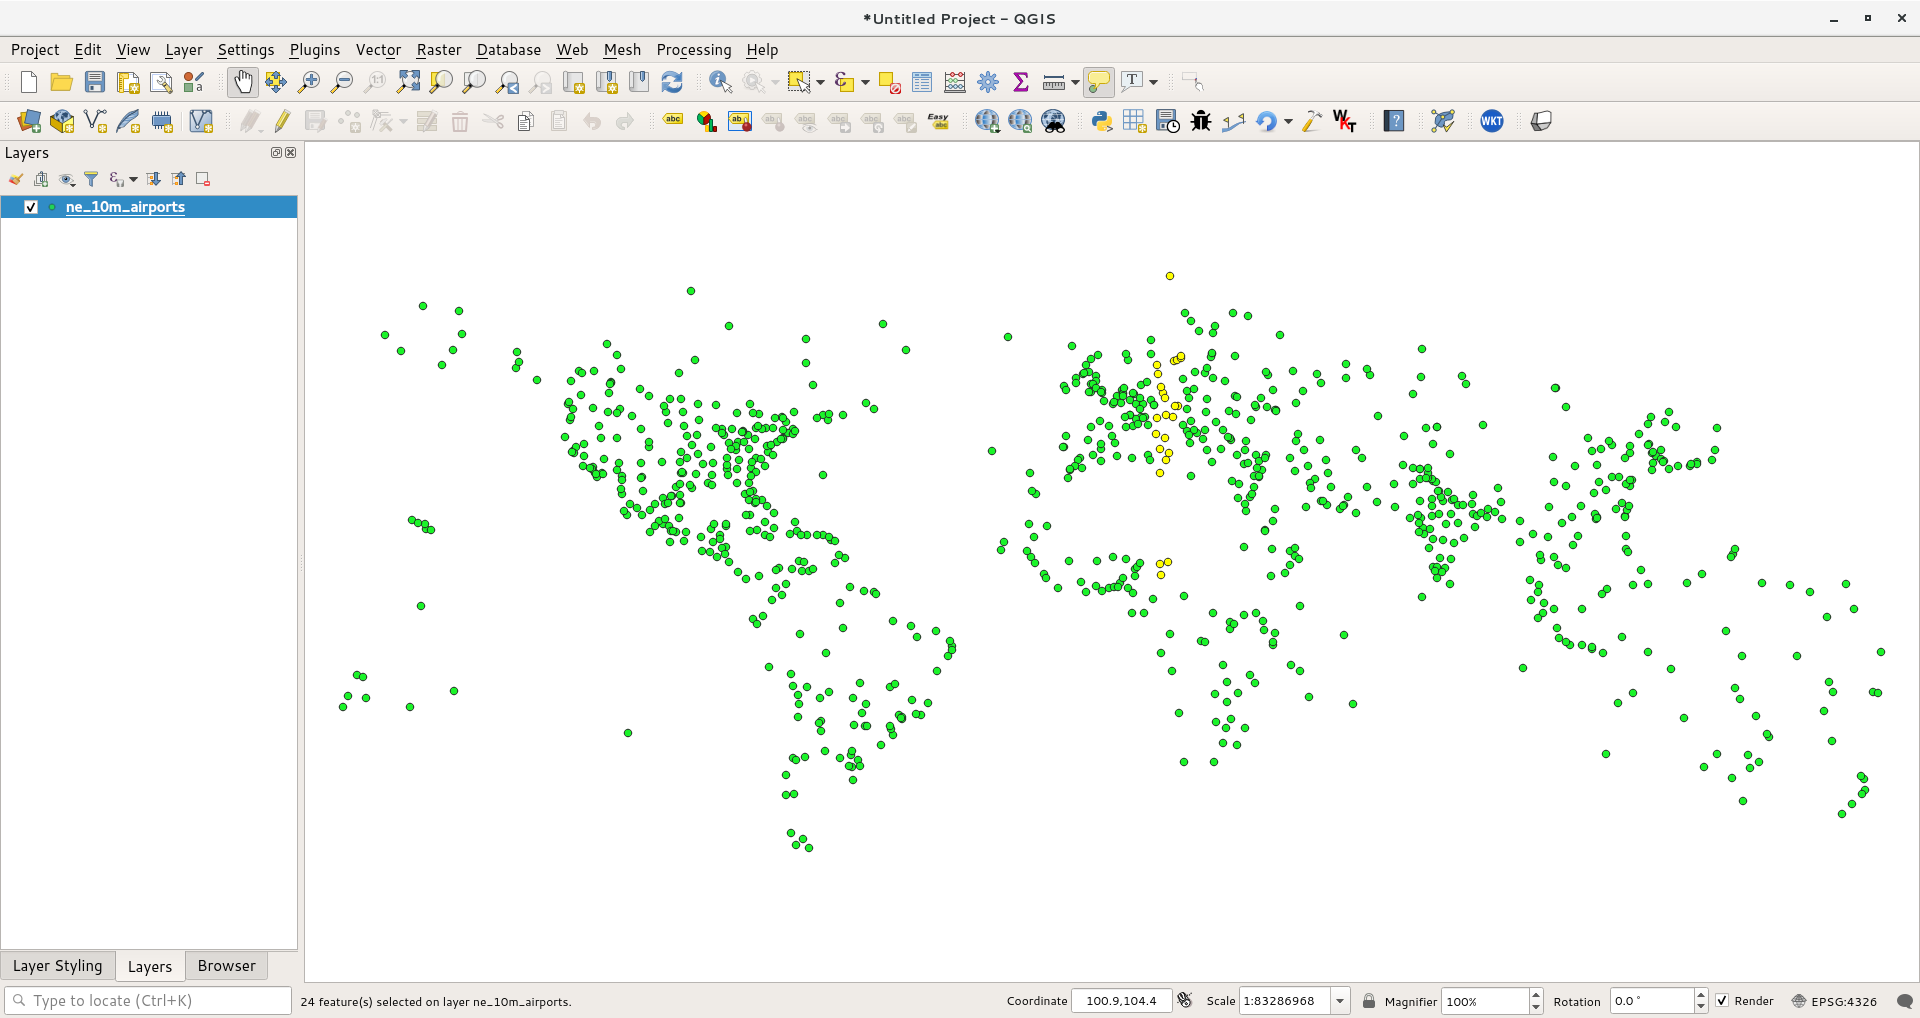
Back in the main QGIS window, you should see some points highlighted
in yellow. These are the points falling in the UTM Zone we specified
in the expression. You could also use the ZoomtoFeatures button to
zoom into the selection.
You saw how we defined and used a custom function to select features
by expression. We will now use the same function in another context.
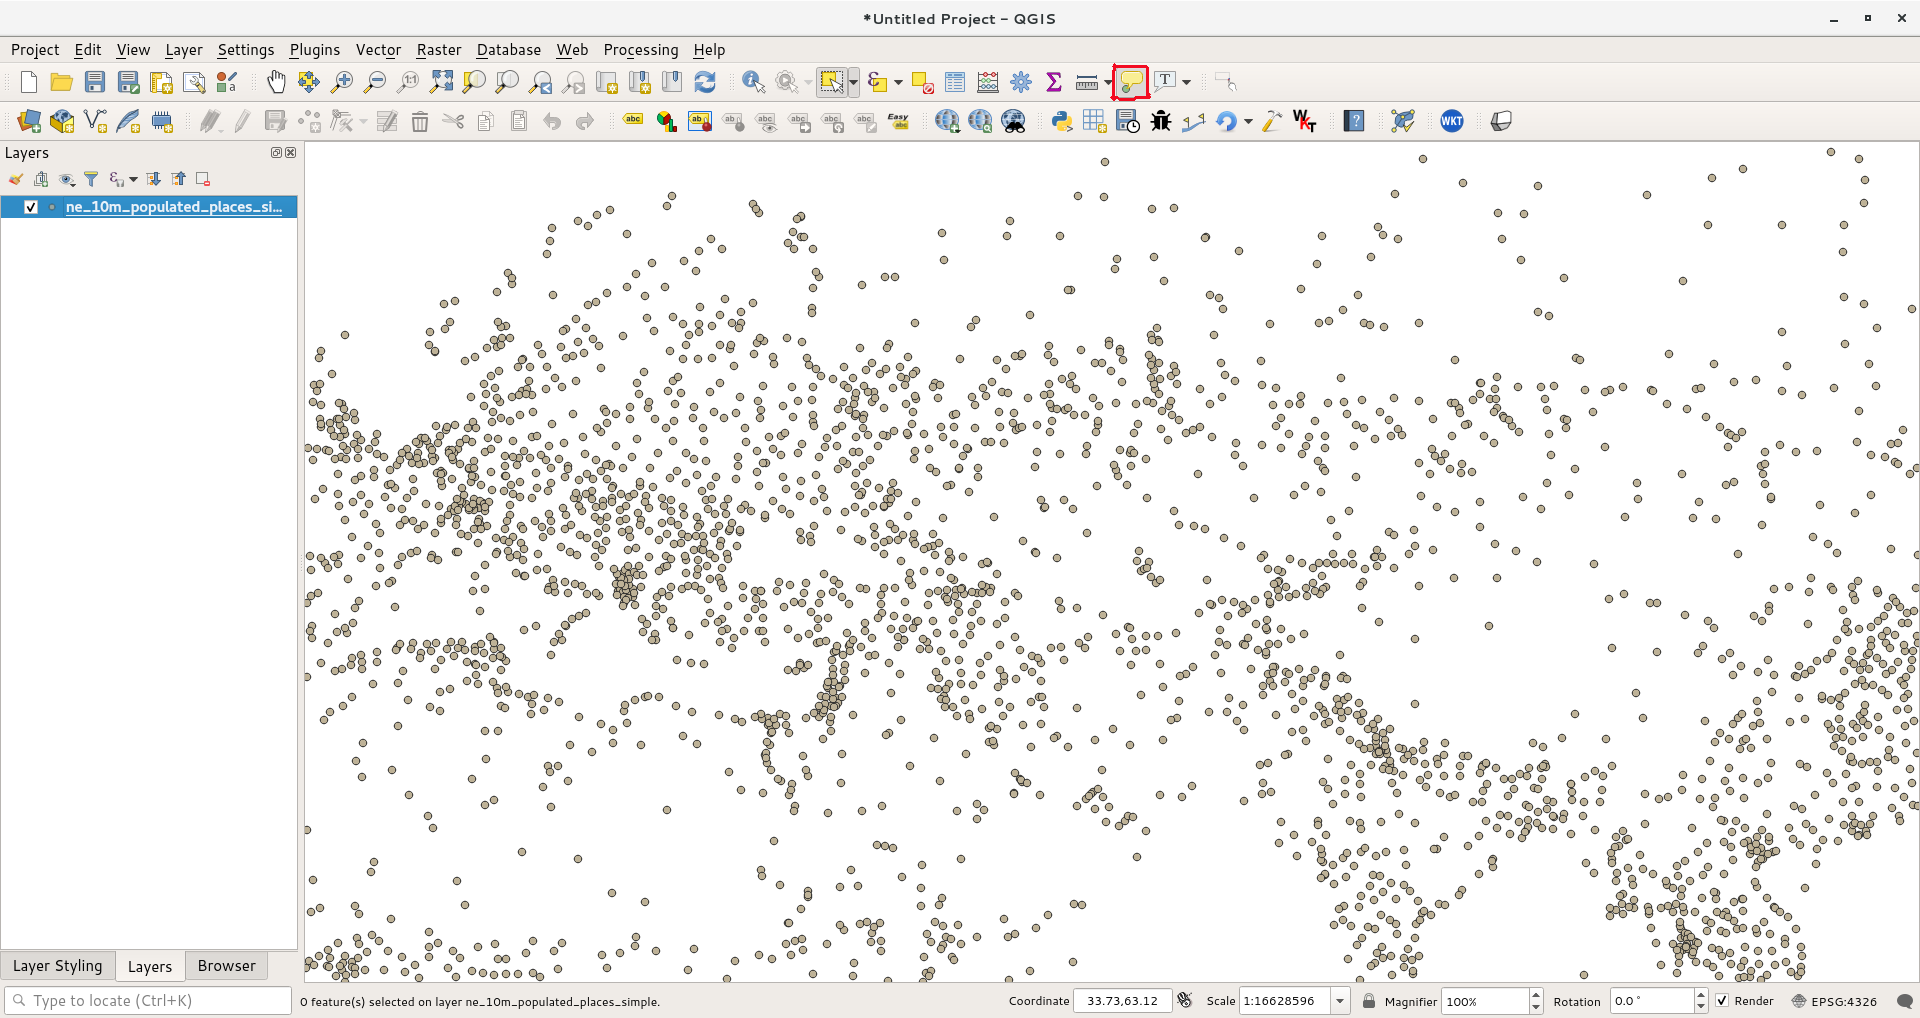
One of the hidden gems in QGIS is the MapTip tool. This tool
shows user-defined text when you hover over a feature. Right-click
the ne_10m_populated_places_simple layer and select Properties.
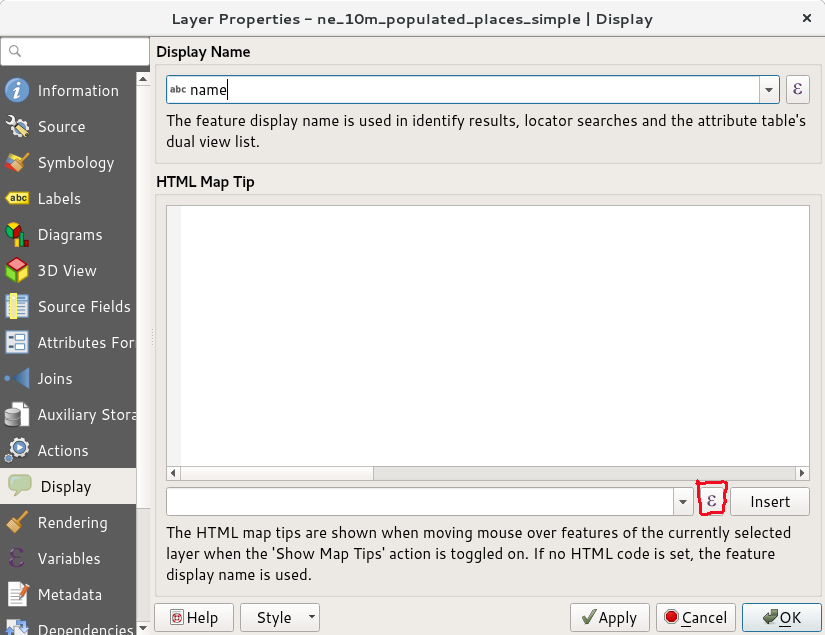
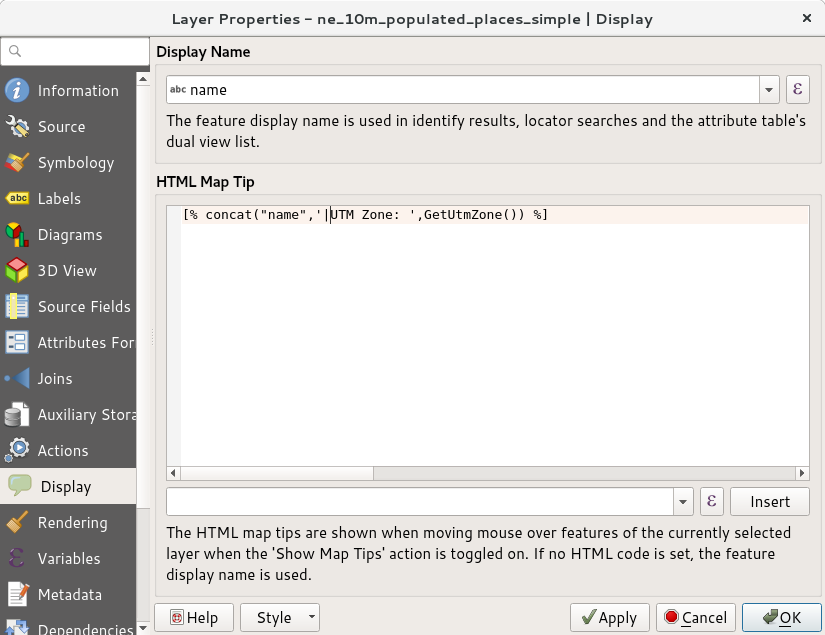
Switch to the Display tab. Here you can enter any text that will be
displayed when you hover over the features of the layer. Even
better, you can use layer field values and expressions to define a
much more useful message. Click on the Ɛ button.
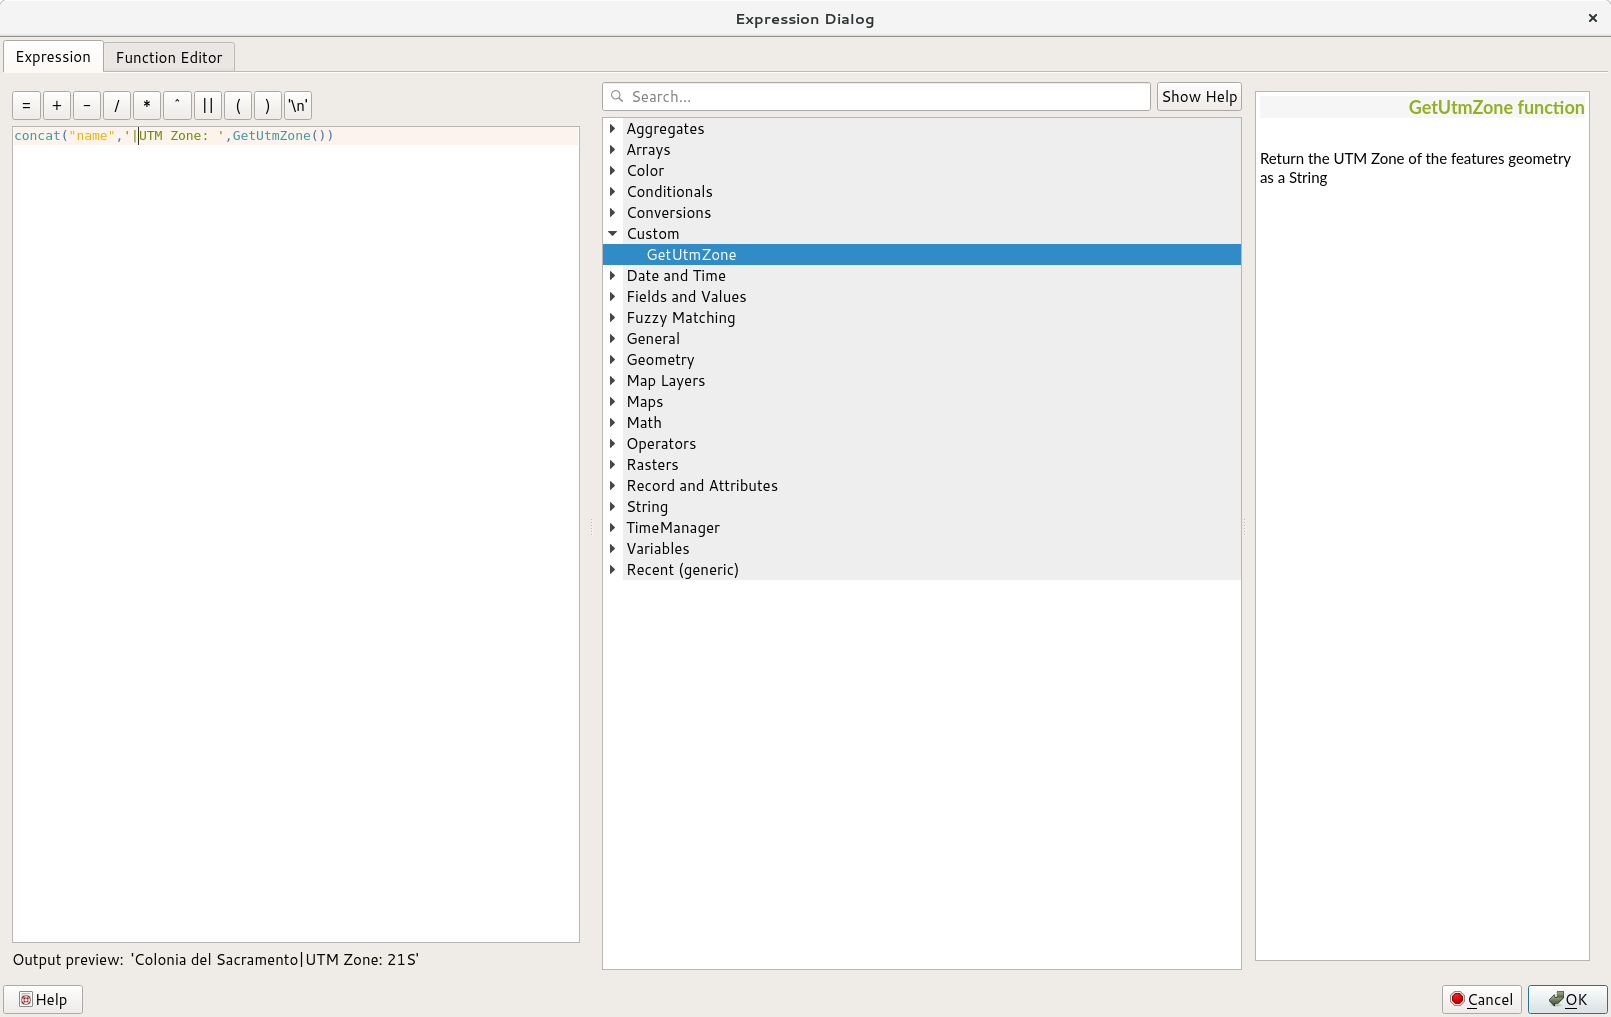
You will see the familiar expression editor again. We will use the
concat function to join the value of the field name and the
result of our custom function GetUtmZone. Enter the following
expression and click OK.
concat("name",'|UTM Zone: ',GetUtmZone())
You will see the expression entered as the value of the Display
text. Click Insert to add it to the HTML box and then press
OK.
Before we proceed, let us de-select the features that were selected
in the previous step. Go to View –> Select –> Deselect Features
from All Layers.
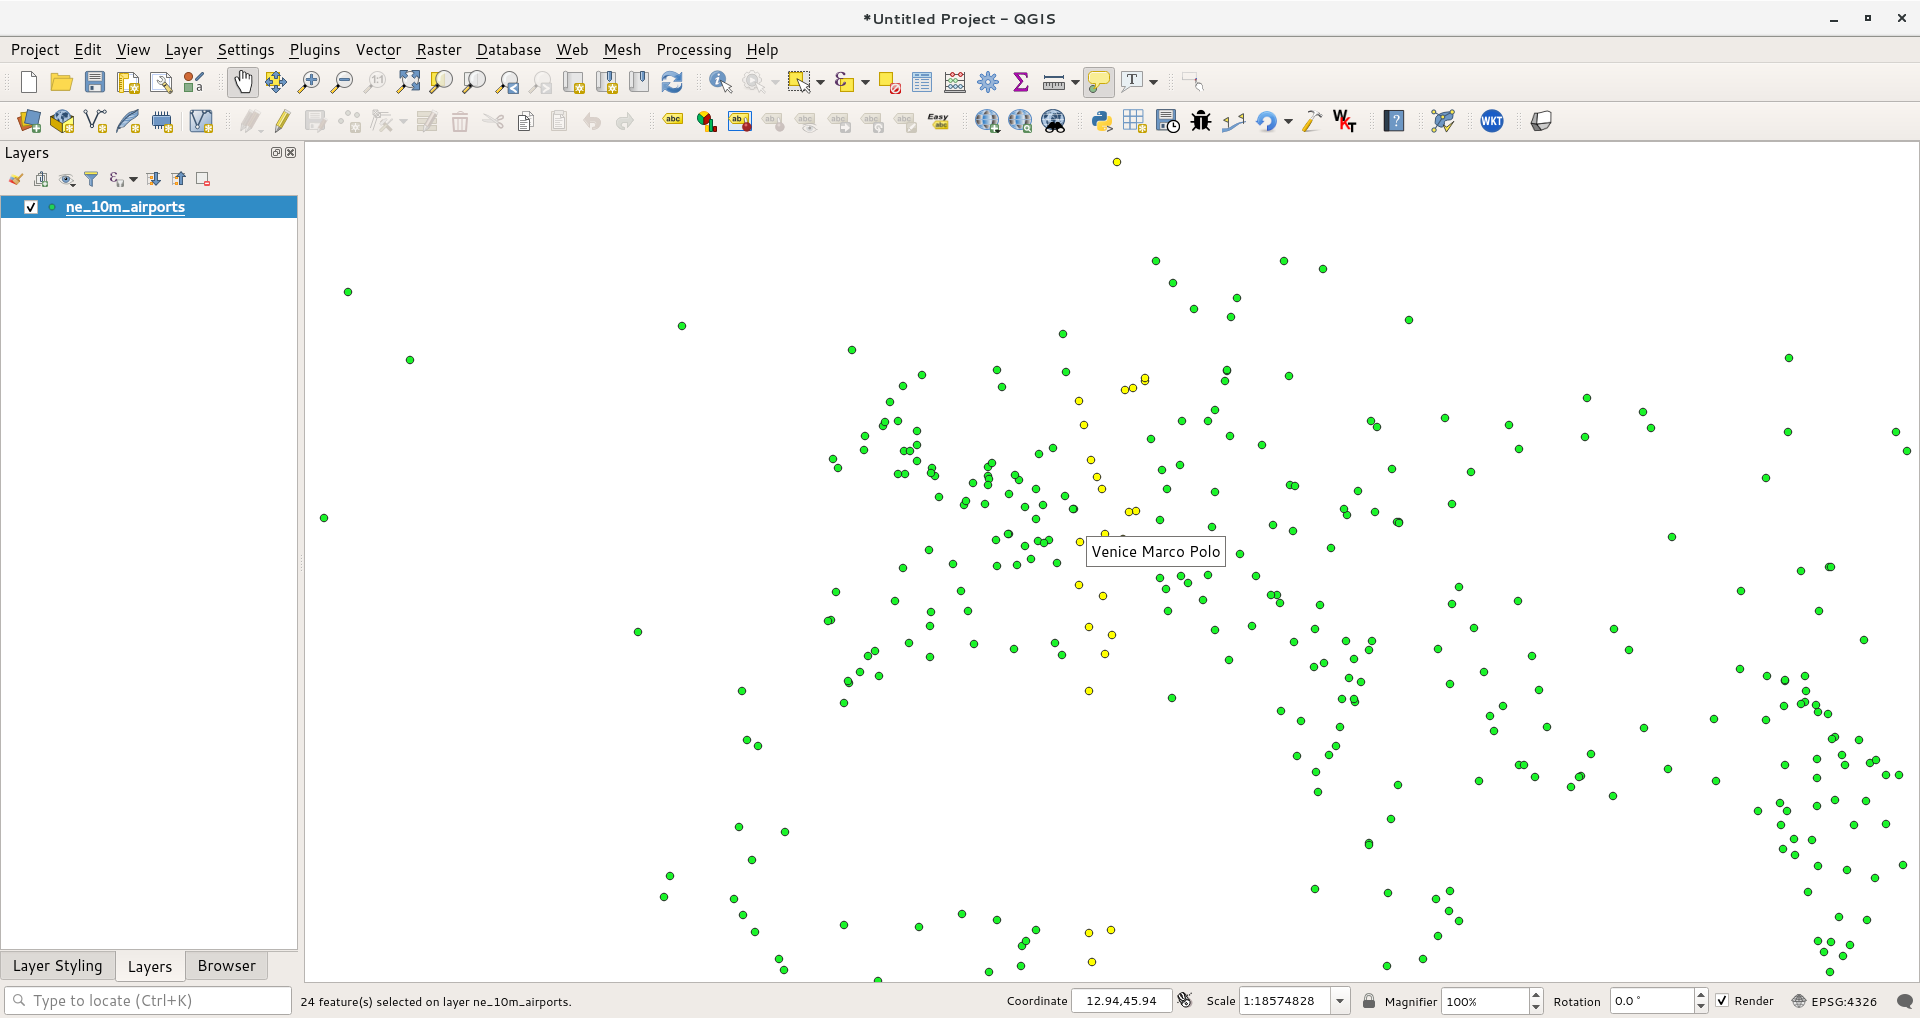
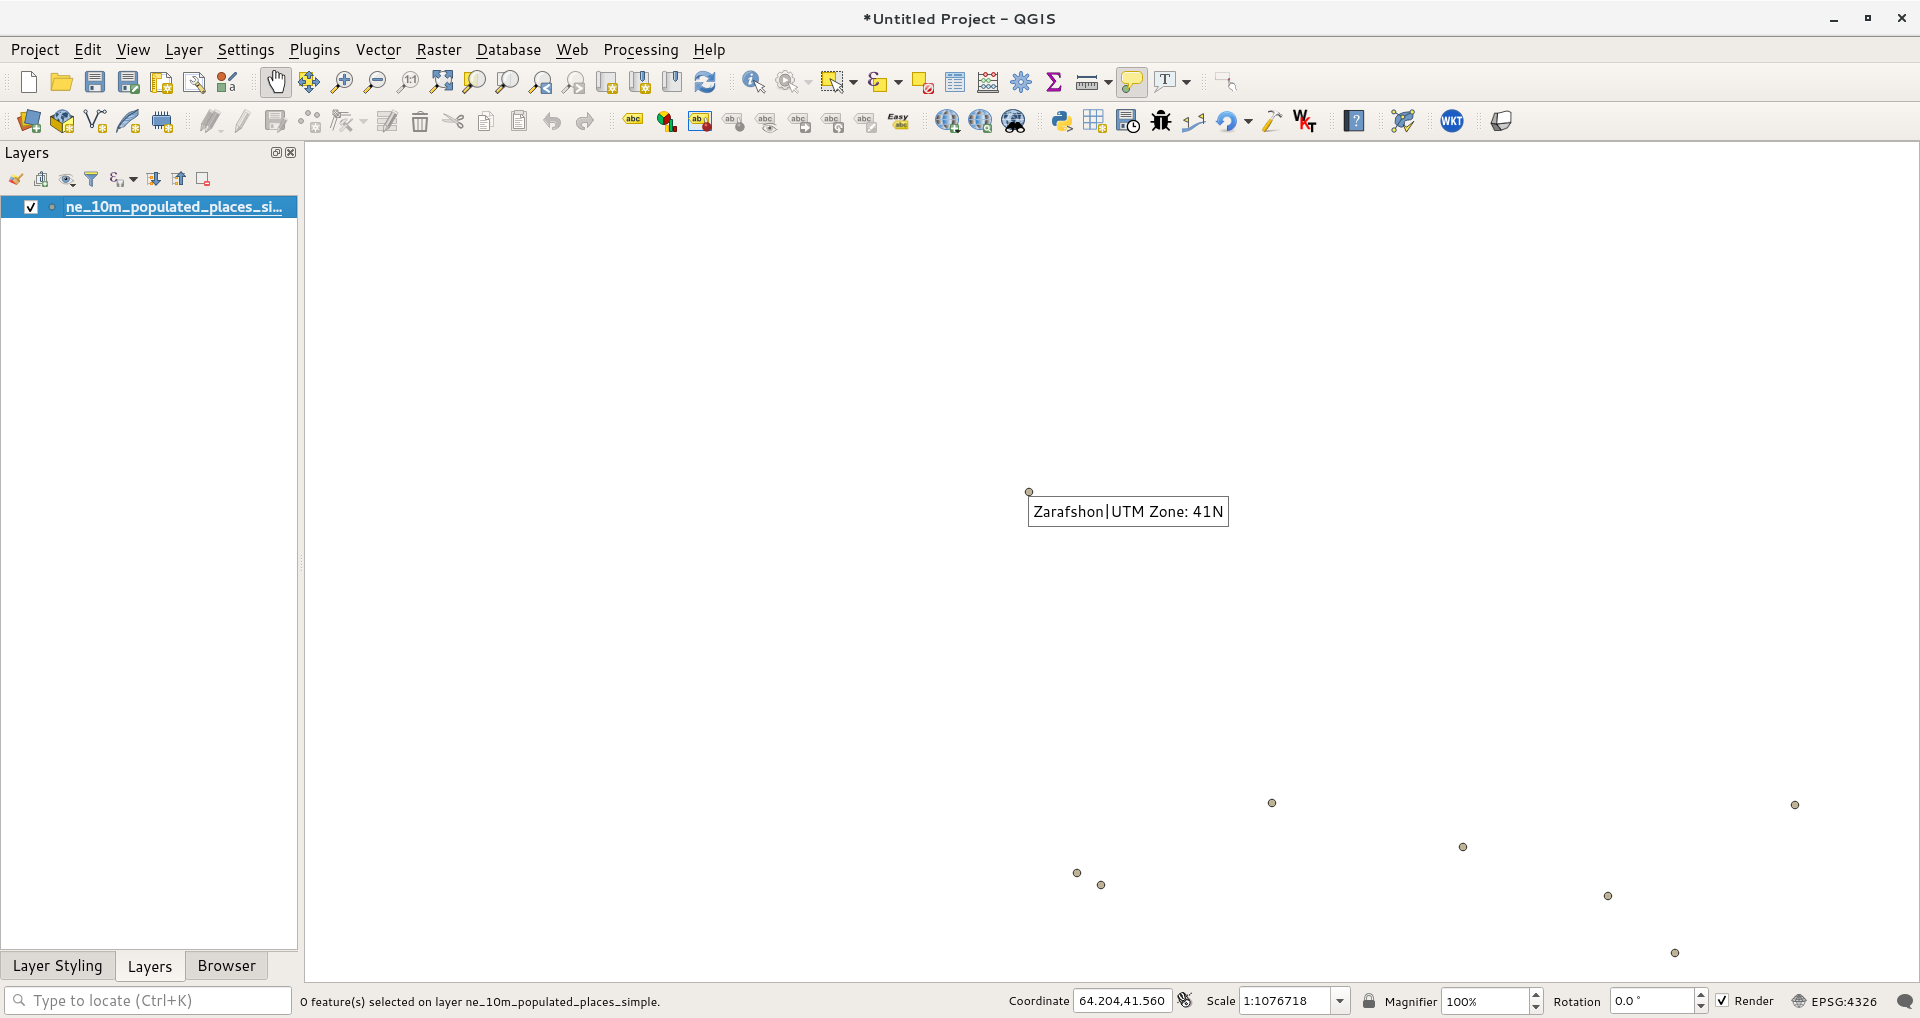
Activate the MapTips tool by going to View –> Map Tips.
Zoom into any area of the map and put your mouse cursor over any
feature. You will see the name of the city and corresponding UTM
zone displayed as the map tip.