Web mapping is a great medium to publish your GIS data to ther web and make it
accessible by other users. Creating a web map is a very different process than
creating one in a GIS. GIS users are typically aren’t web programmers and it
presents a challenge when one needs to create a web map that is of the same
quality as a map creating in a GIS. Fortunately, there are tools available to
easily translate your work in QGIS to web maps. In this tutorial, you will
learn how to use the QGIS2Web plugin to create a web map using OpenLayers
or Leaflet lubraries from your QGIS project.
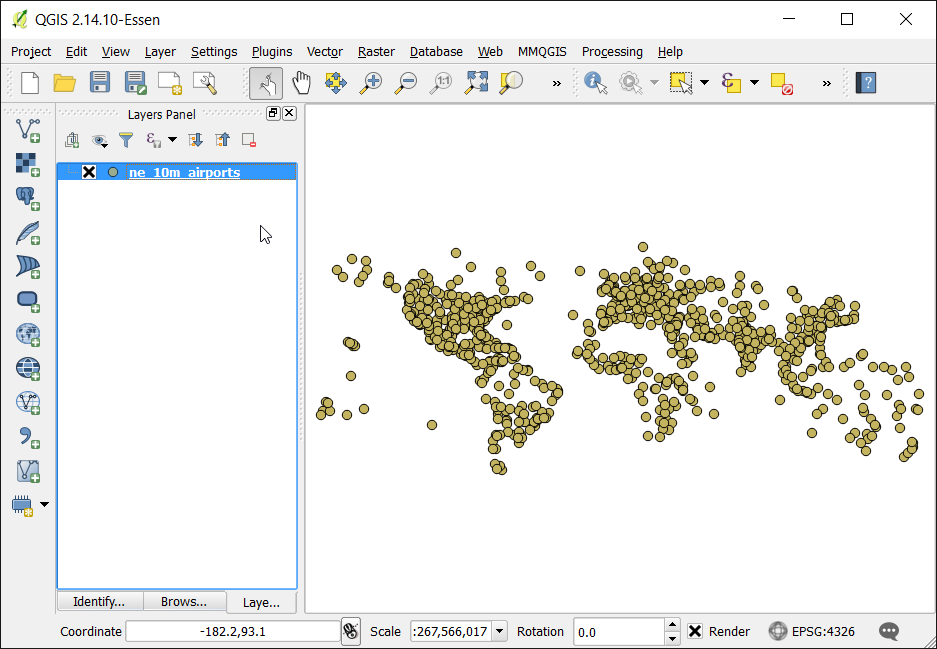
Open QGIS and go to
Layer ‣ Add Vector Layer. Browse to the location of the
downloaded file and select ne_10m_airports.zip. Click OK.
We will now create a map in QGIS that looks and behaves just like we would
like in the web map. The plugin qgis2web will use replicate the QGIS
settings and automatically create the web map without us knowing about web
mapping libraries. When a user clicks on a airport marker, we want an
info-window to disply useful information about the airport. This information
is already present in the attribute table of the ne_10m_airports layers.
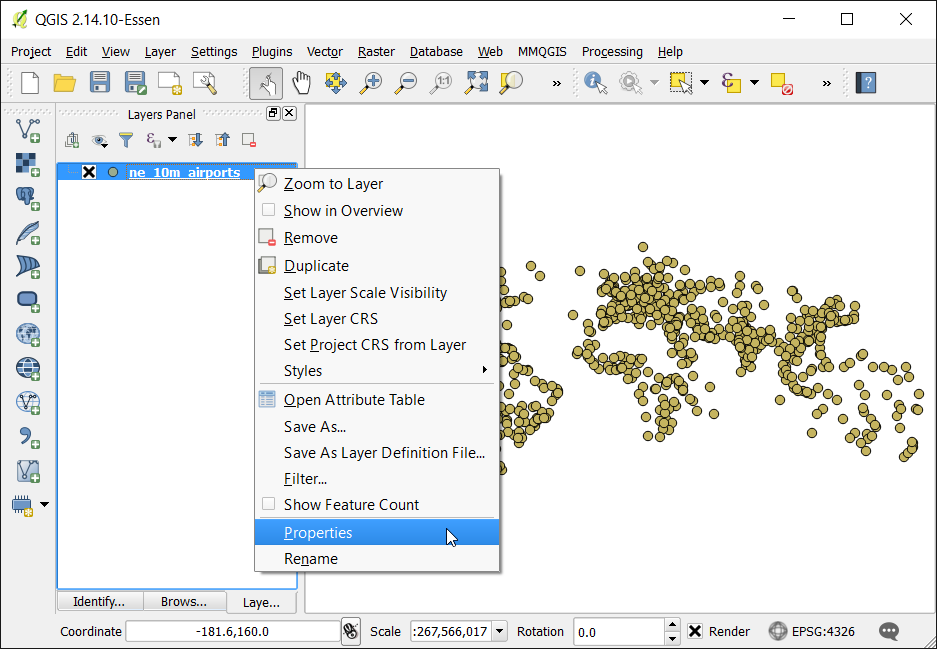
Right-click on the ne_10m_airports layer and select
Properties.
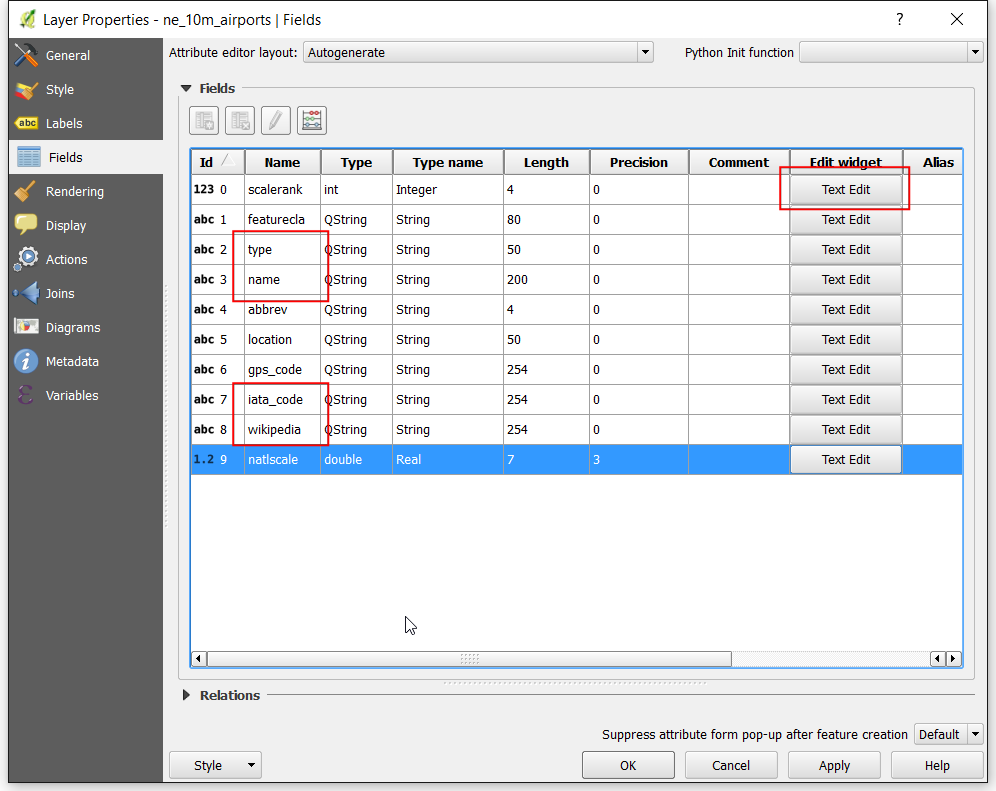
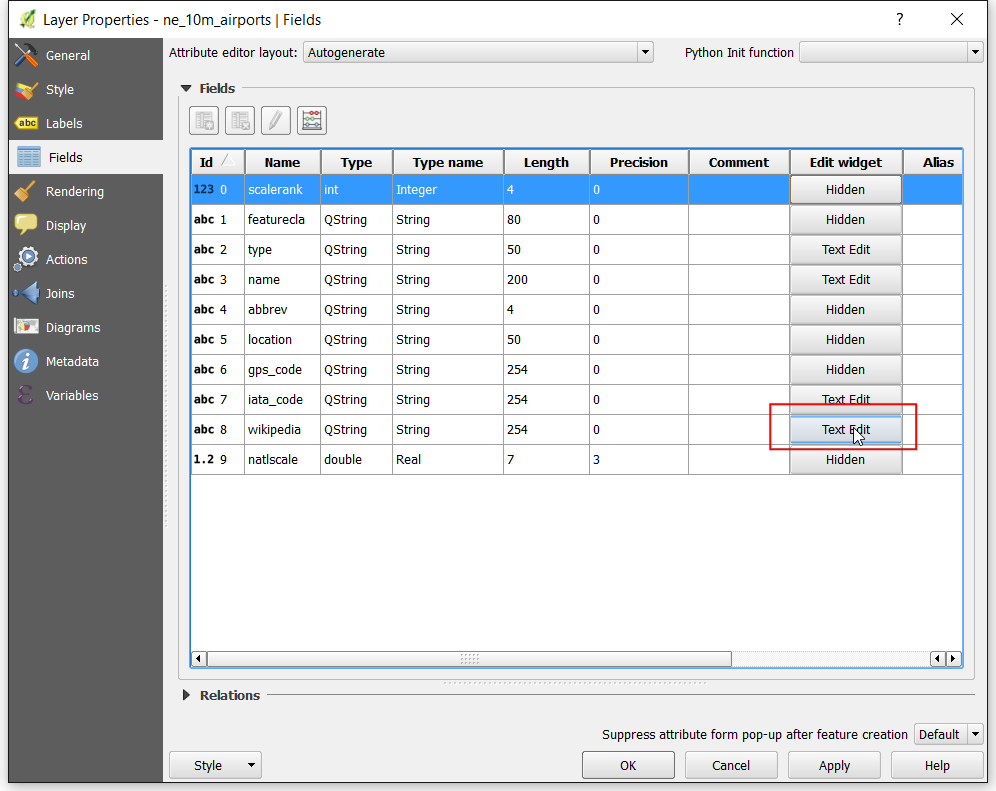
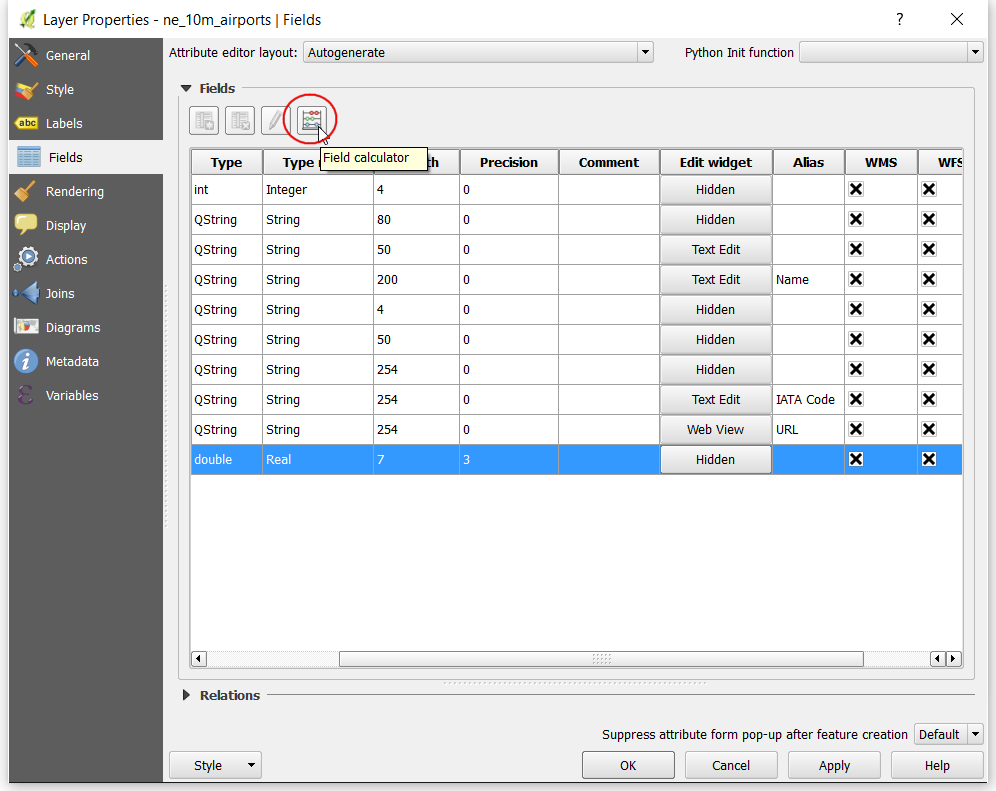
Switch to the Fields tab. You will notice the different
attributes present in the layer. Some of these aren’t relevant to the users
of our web map, so we can choose to hide these. We will keep type,
name, iata_code and wikipedia fields and hide the others. Click
on Text Edit button under the Edit widget column
for `scalerank field.
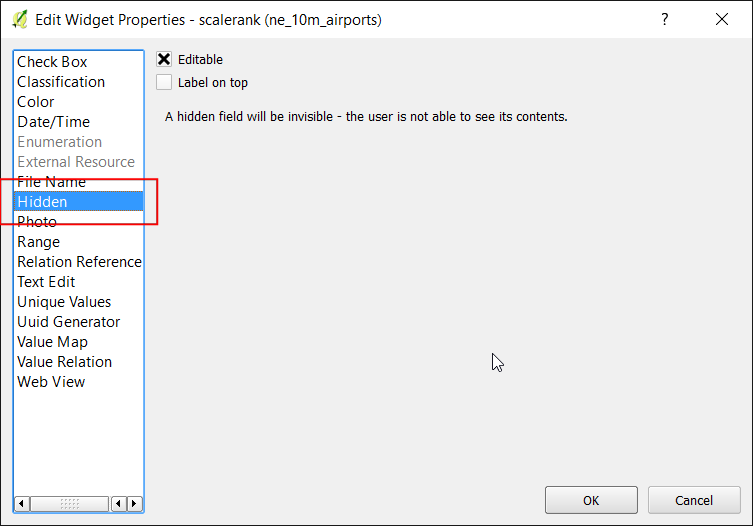
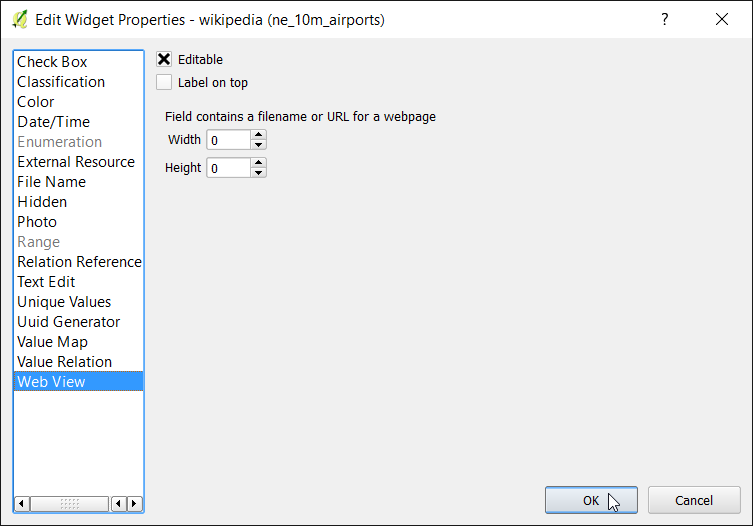
In the Edit Widget Properties dialog, choose Hidden as the
type. Click OK.
Similarly set other fields to Hidden type. As you may have notices, there
are other field types available that allow us to set how the fields appear
to the users of our map. Click Edit Widget for wikipedia
field.
Select WebView as the field type. This type indicates that the value
contained in this field is a URL.
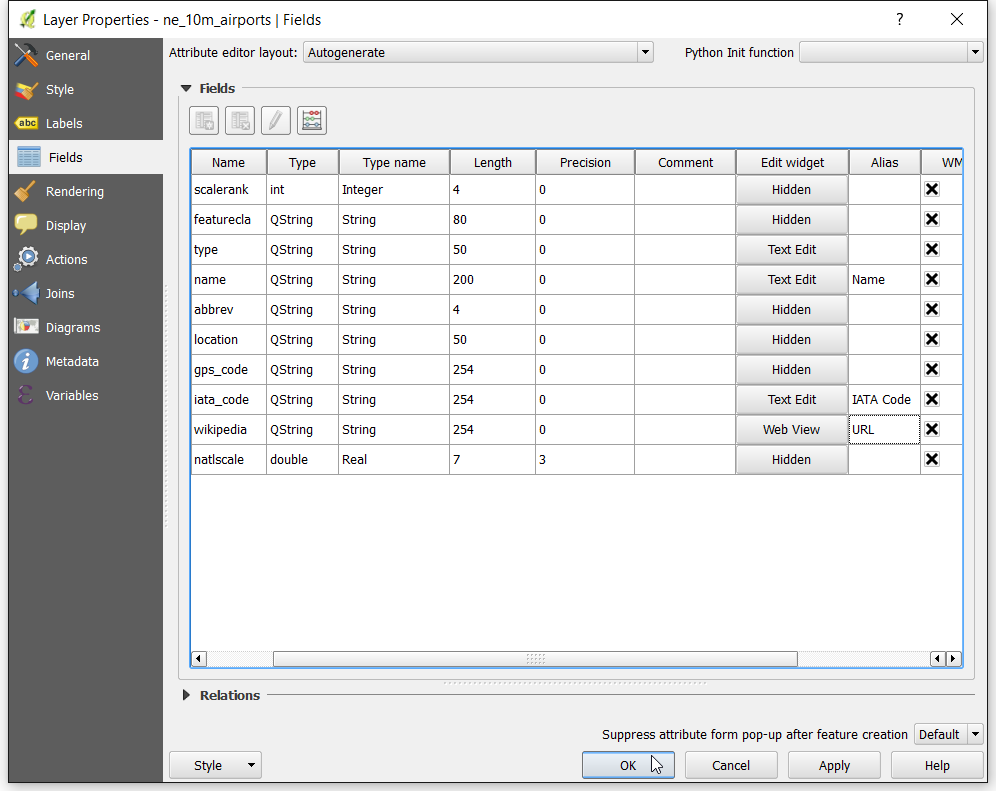
We can also use the Alias column to indicate an alternate name
for the fields without actually changing the underlying data table. This is
useful to give more user-friendly field names to the users of our map. Add
aliases as per your choices and click Ok.
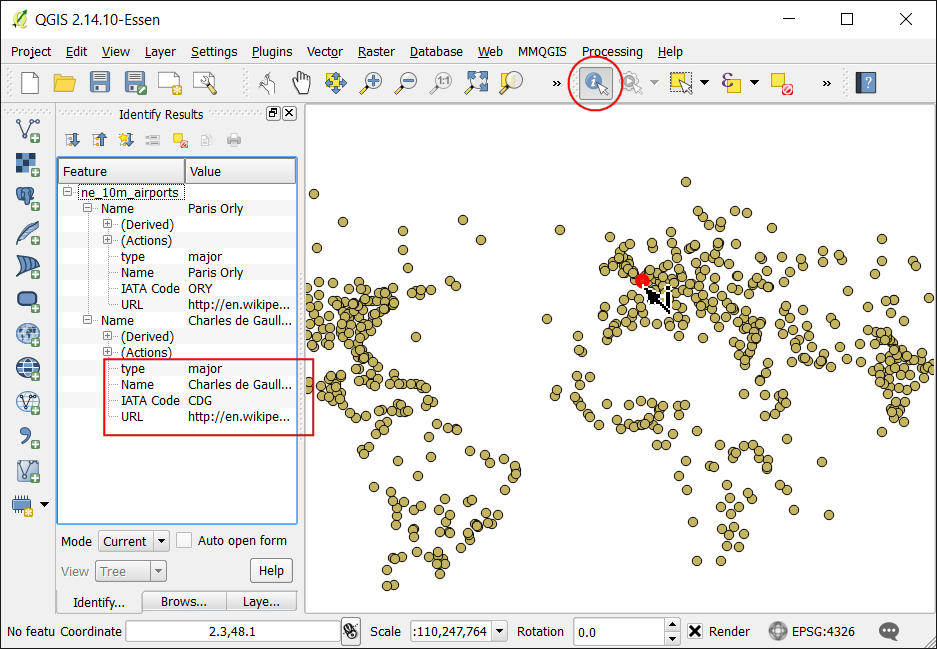
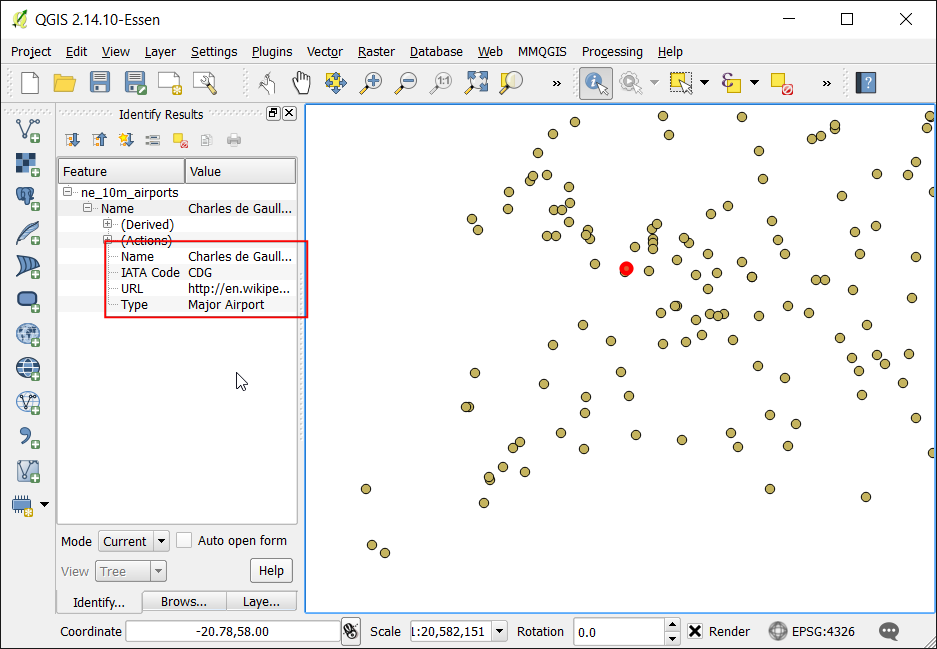
Back in the main QGIS window, choose the Identify tool and click
on any point. The Identify Results panel will display the
nicely formallted attributes with the newly added aliases. You will notice
that the hidden fields do not appear in the results.
While this method is useful, there is one limitation. We are not able to
change the order of the fields. One way to overcome this limitation is to
create a VirtualField. In our case, if we wanted the type field to
appear at the end of the info window, we can simply add a new virtual field
the end and hide the original type field. While we are at it - we can
also use an expression to better format the type values. Right-click the
ne_10m_airports layer and choose Properties. Go to the
Fields tab and click Field Calculator.
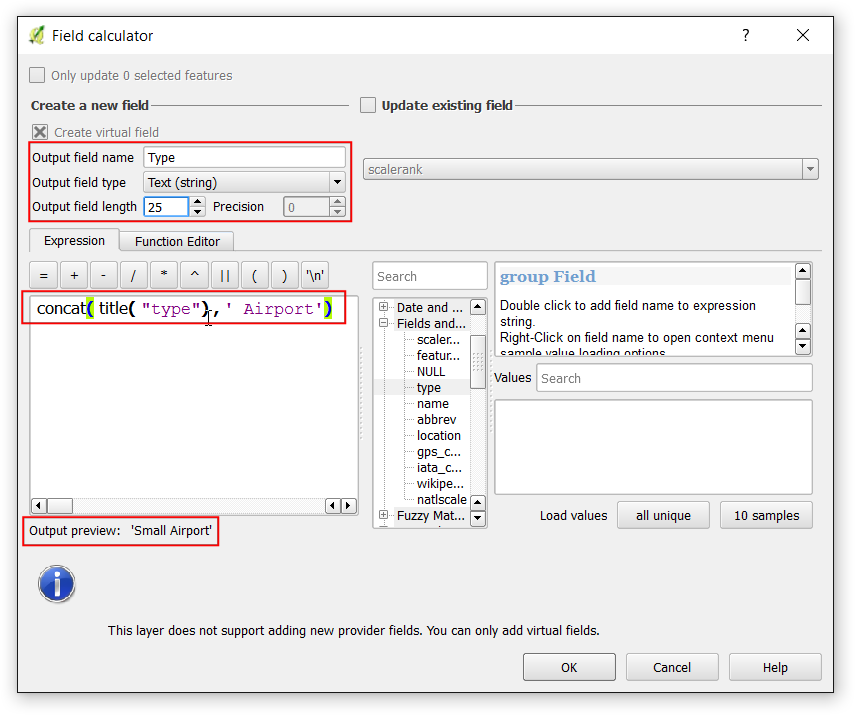
As the field names need to be unique, use Type as the new field name.
Set the field type to Text(String) with a length of 25 characters.
The field type contains values such as small, mid, large
etc. We can add an expression to change the case of the words to sentence
case and append the word airport for better readability. Enter the
following expression in the Expression box and click
OK.
concat( title("type"), ' Airport')
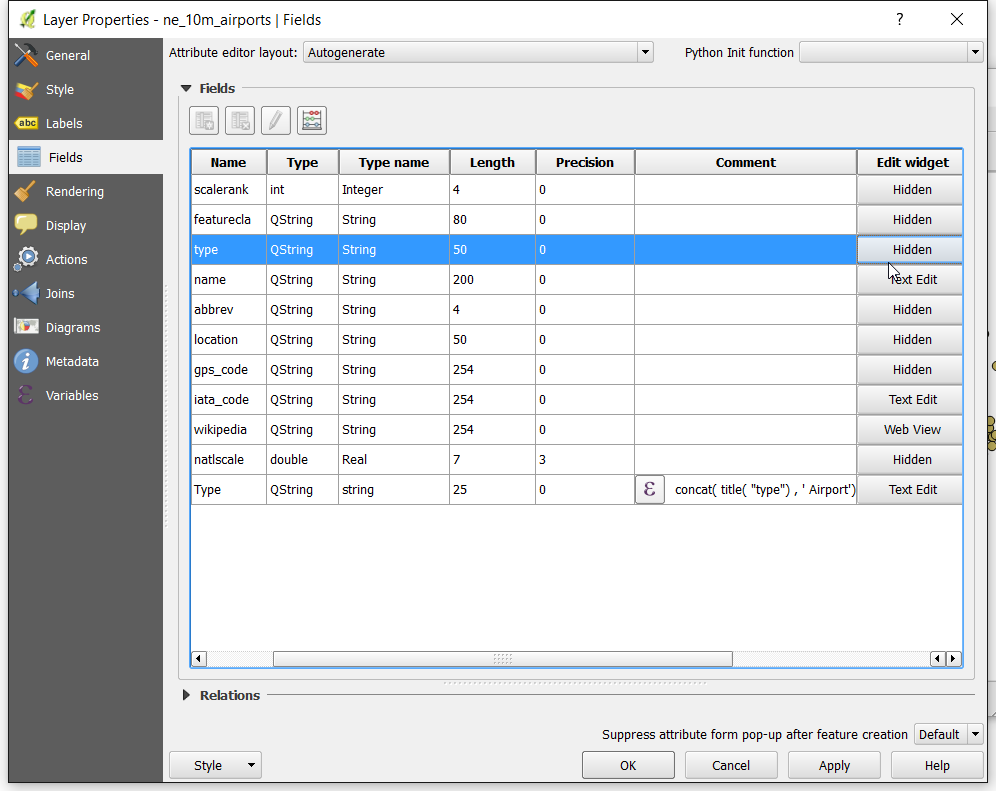
Now that we have a much better looking Type field, you can go ahead and
set the Edit Widget for type field to Hidden.
Use the Identify tool to verify that the attributes appear as
expected.
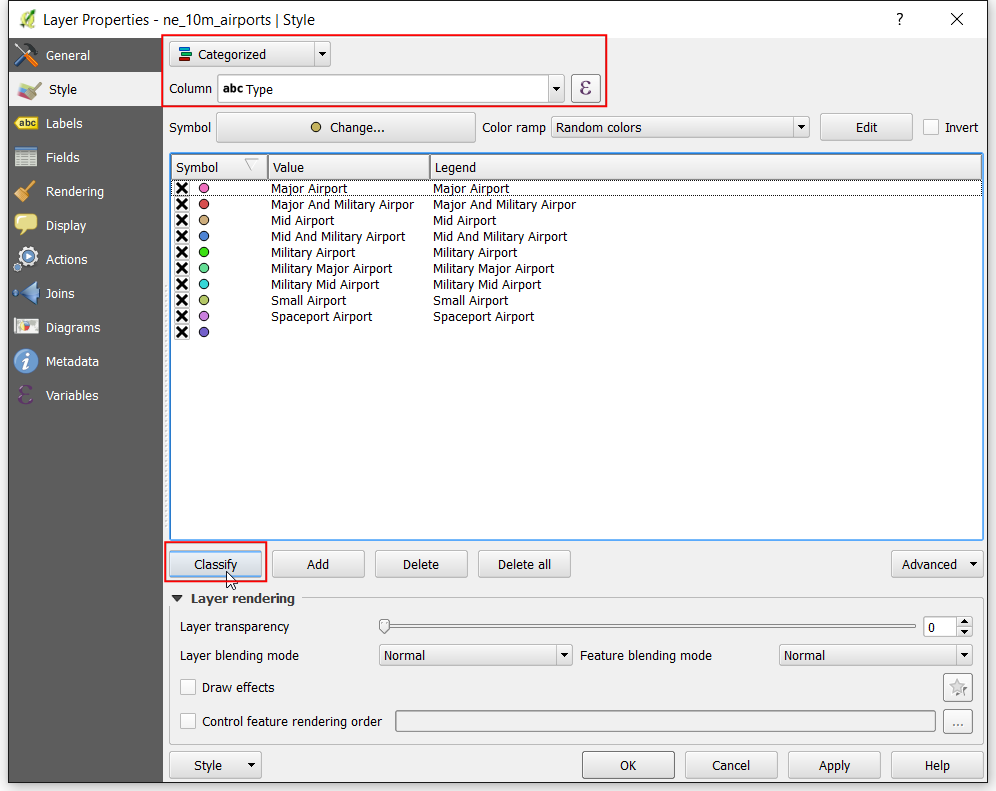
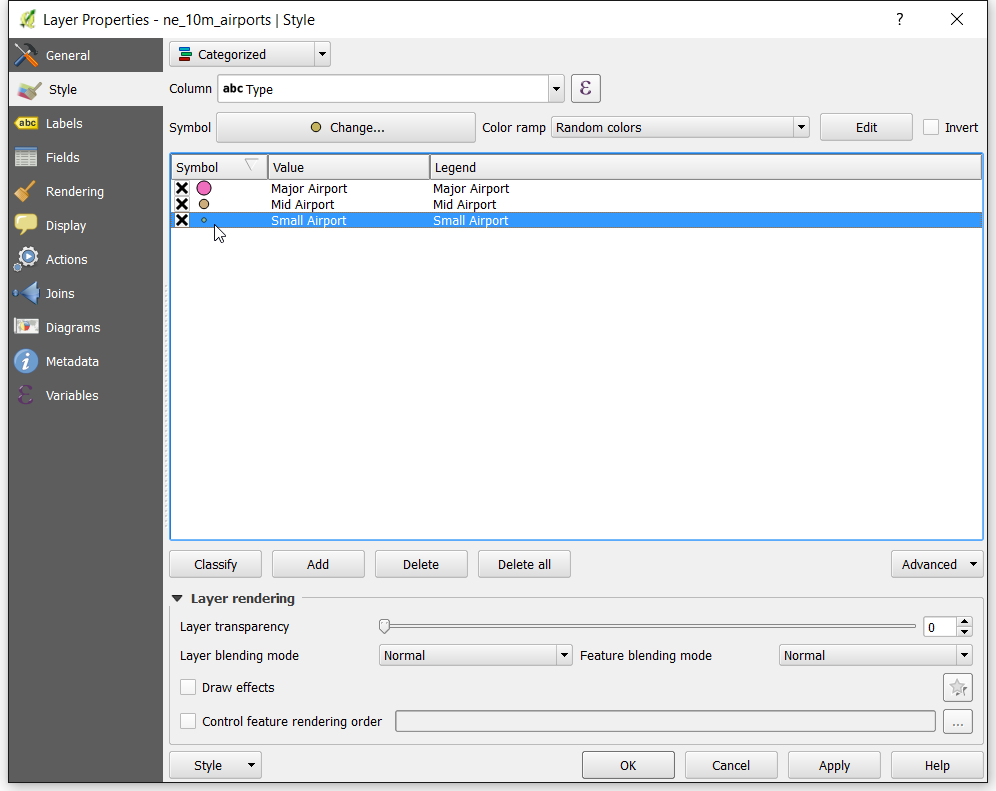
Now let’s style our layer to be more visually appealing and informative.
Right-click the ne_10m_airports layer and select
Properties. Switch to the Style tab. Choose
Categorized style and our virtual field Type as the
Column. Click Classify.
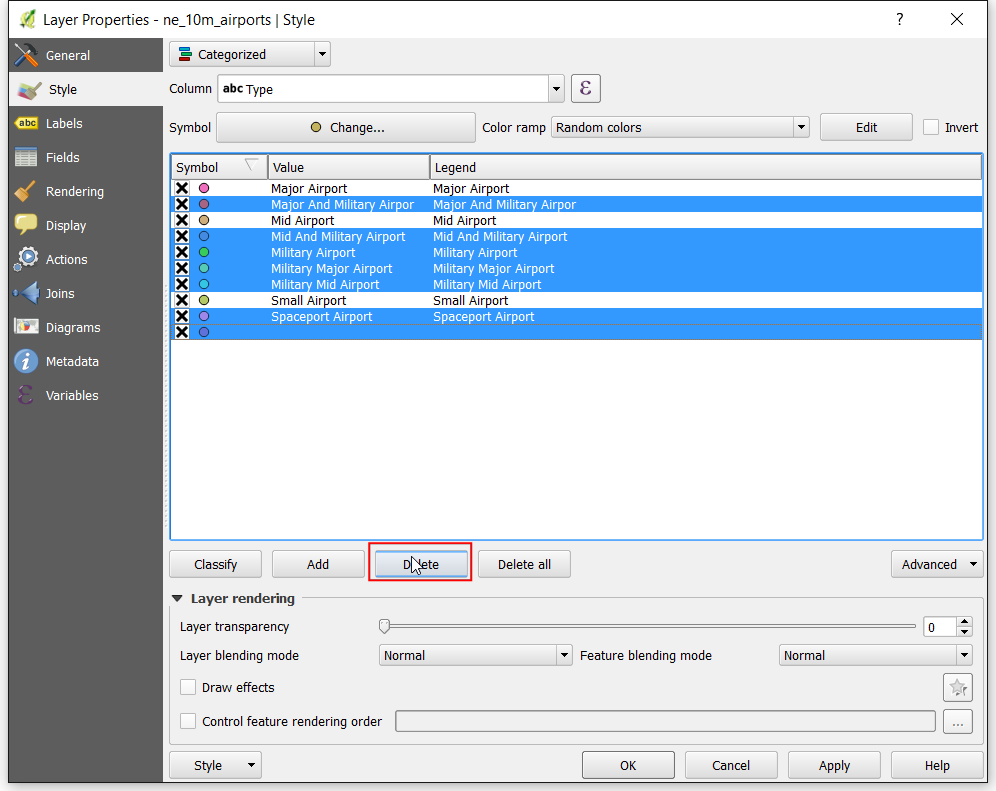
You will see a different colored circle gets assigned to a differnt type of
airport. For the purpose of this tutorial, we will restrict the map to
civilian airports. Hold the Ctrl key and select all categories for
military airports. Once selected, click Delete.
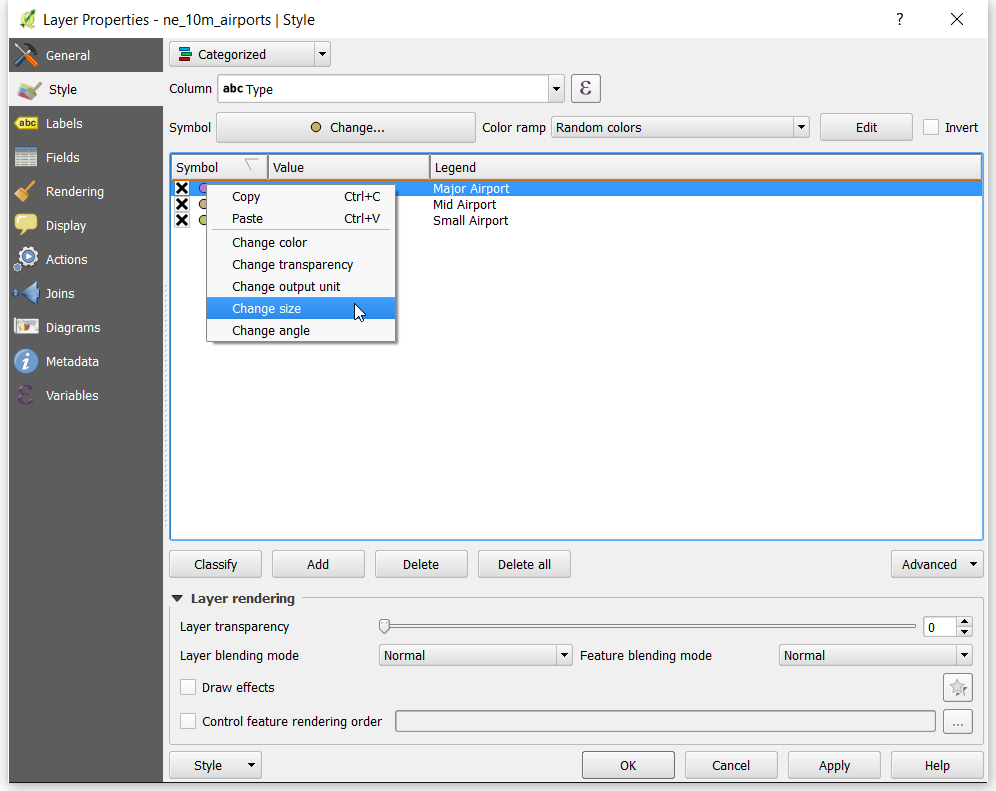
Apart from assigning a different color to the category, we can change the
size of the symbol to visually help our users distinguish different type
of airports. Right-click on a category and select Change
size.
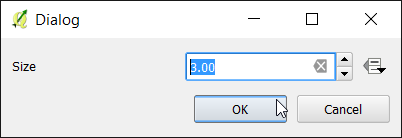
Set the Size value to 3 for the LargeAirport category.
Similarly, set the Size to 2 for MidAirport and 1
for SmallAirport.
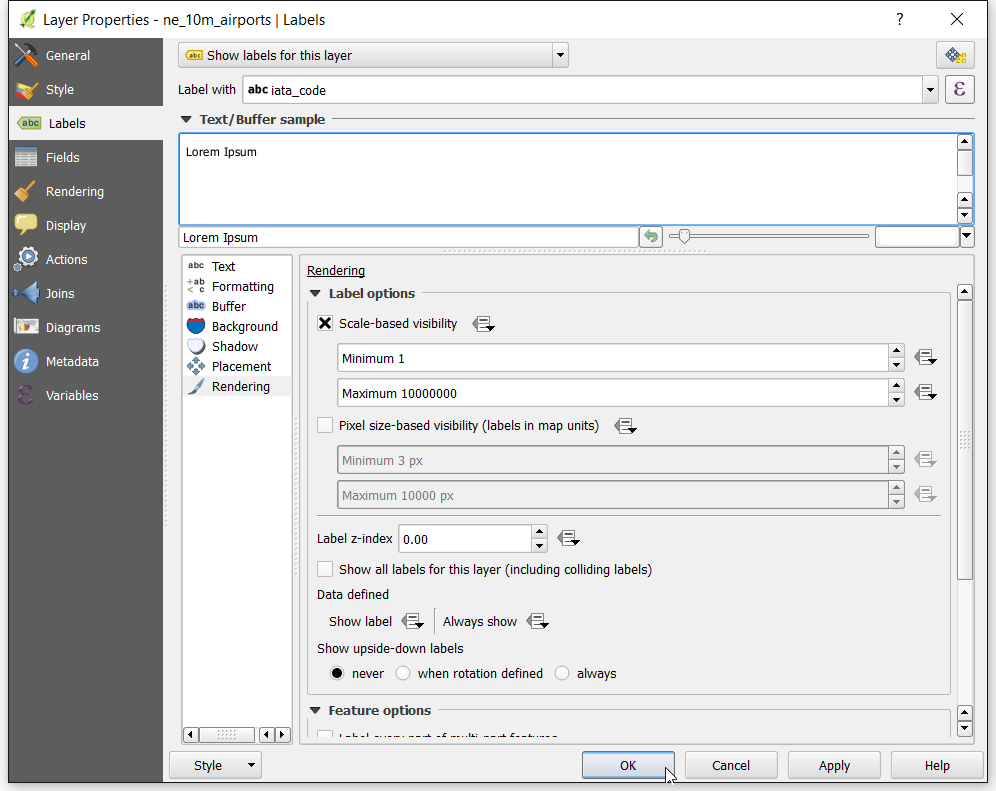
For a complete map, we also need to label each airport. Switch to the
Labels tab in the Properties dialog. Select Showlabelsforthislayer and choose iata_code as the value for
Label with. We will also set Rendering option so
that the labels only appear when the user is sufficiently zoomed in. Check
Scale-based visibility under Label options. Enter
1 as the Minimum scale and 10000000 as the maximum
scale. This setting will render the labels only after the user has zoomed
in more than 1:10000000 scale and will be visible till 1:1 scale.
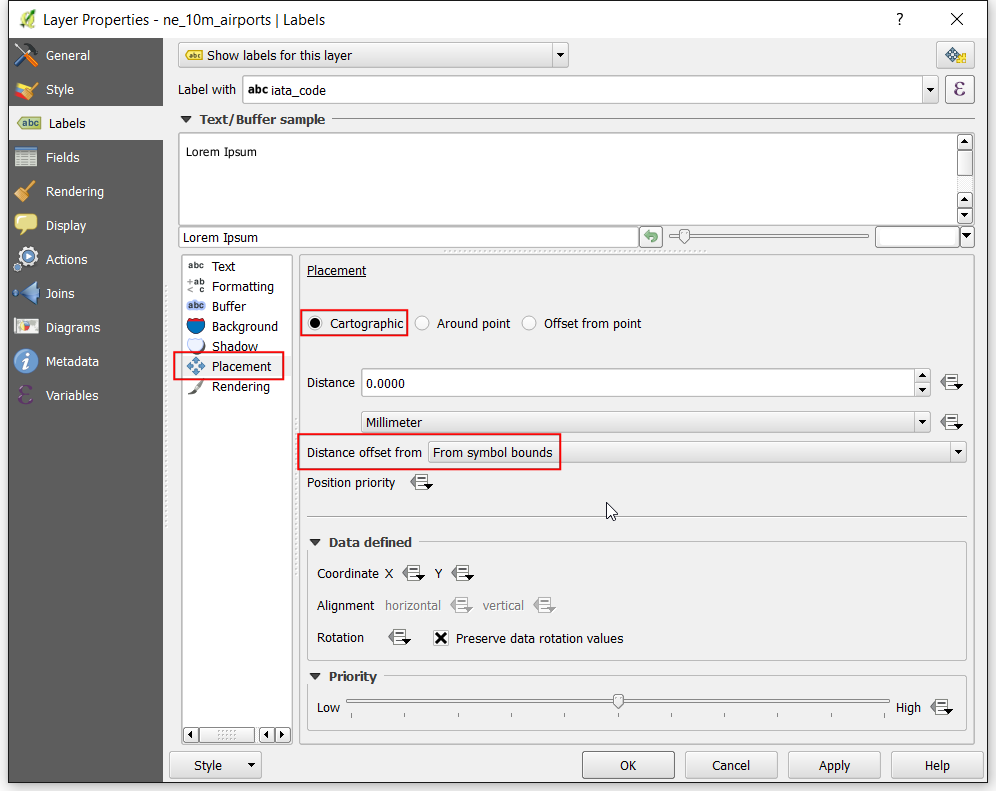
As we are using circles to depict the airports, we need to ensure that the
labels don’t overlap with the circles. Go to the Placement tab
in the Labels dialog and set the Placement to
Cartographic. Select Fromsymbolbounds as Distance
offset from. Click OK.
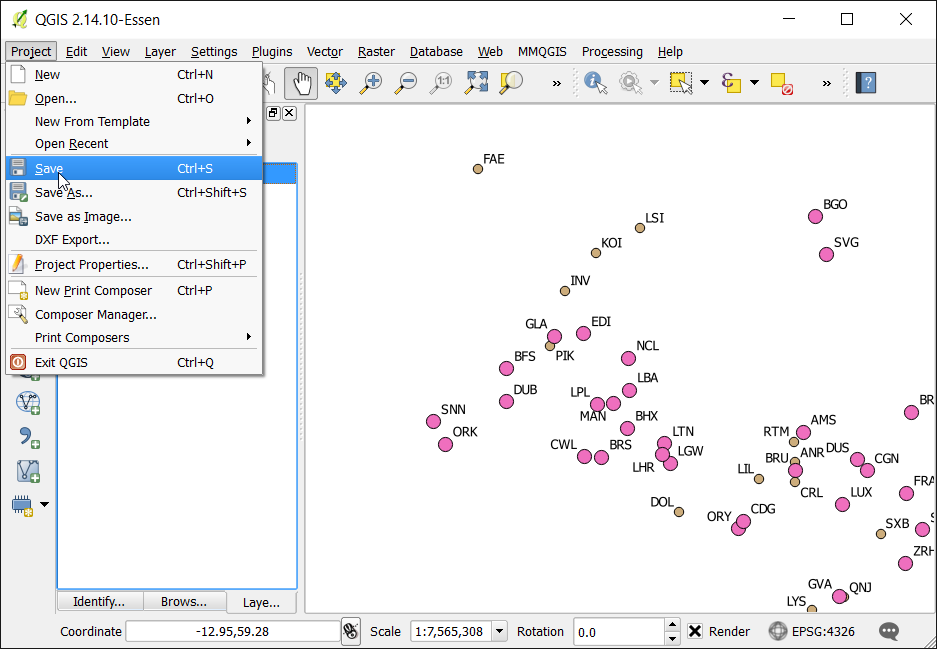
Our map is now ready. This is a good time to save our work. Go to
Project ‣ Save. Enter Airports as the name of the
project.
Now we are ready to export our project to a web map. Install the
qgis2web plugin by going to Plugins ‣ Manage and
Install Plugin (See Using Plugins for more details on installing
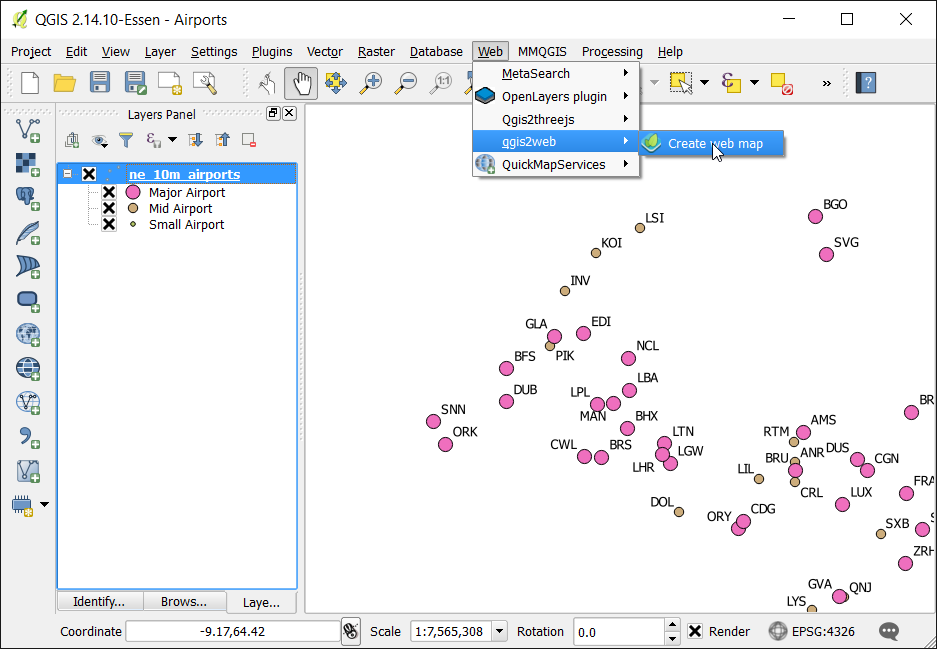
plugins in QGIS). Once the plugin is installed, go to Web ‣ qgis2web ‣
Create a web map.
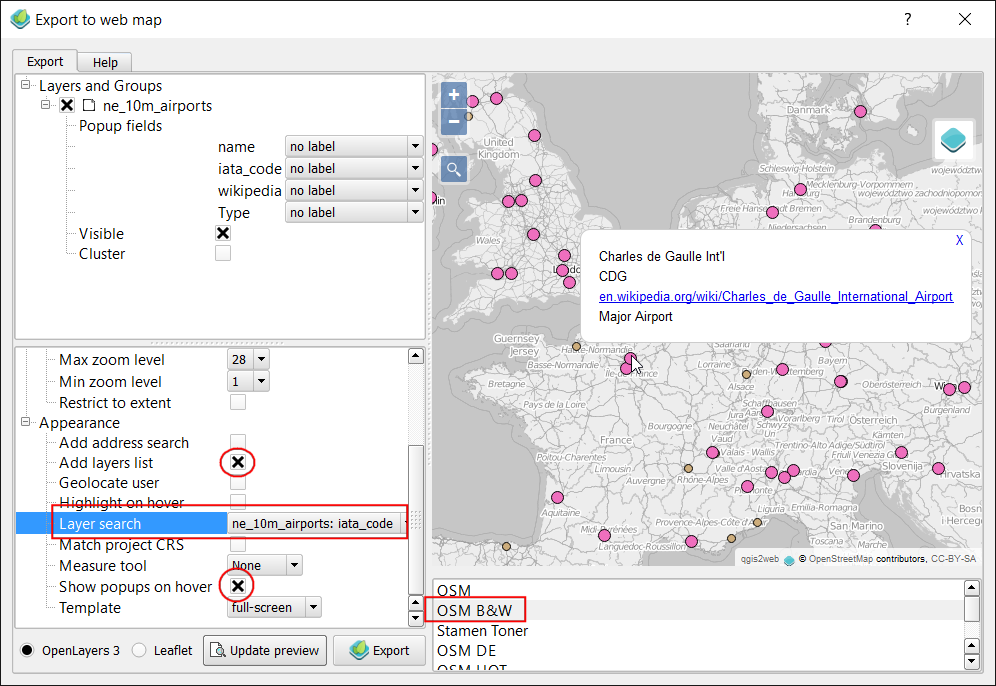
In the Export to web map dialog, check Add layers
list in the bottom panel under the Appearance section. Also
select ne_10m_airports:iata_code as the field for Label
search. Check the Show popups on hover to allow display of
info-windows on hover. We can also set a basemap so the users have more
context when looking at the airports layer. Select OSMB&W to use a
black-and-white themed basemap create using OpenStreetMap data. You also
have an option to choose from either OpenLayers or Leaflet as the
web mapping library. We will restrict this tutorial to use the
OpenLayers library. Click Update Preview` to see how your
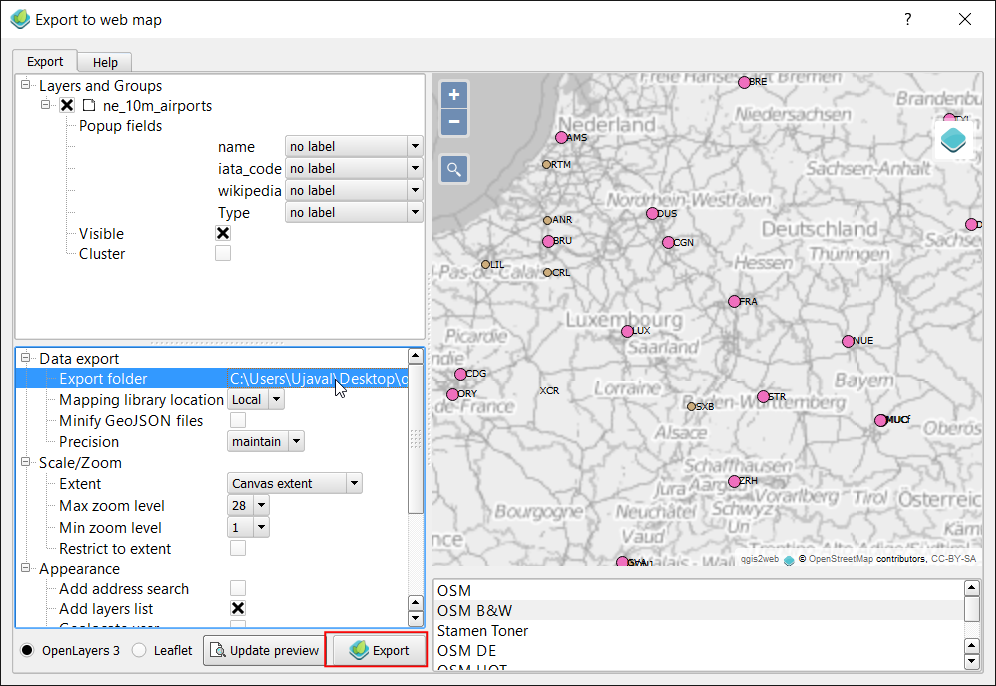
exported map will look like. Before we do the actual export, we need to set
the Export folder. You can select a folder of your choice and
click Export.
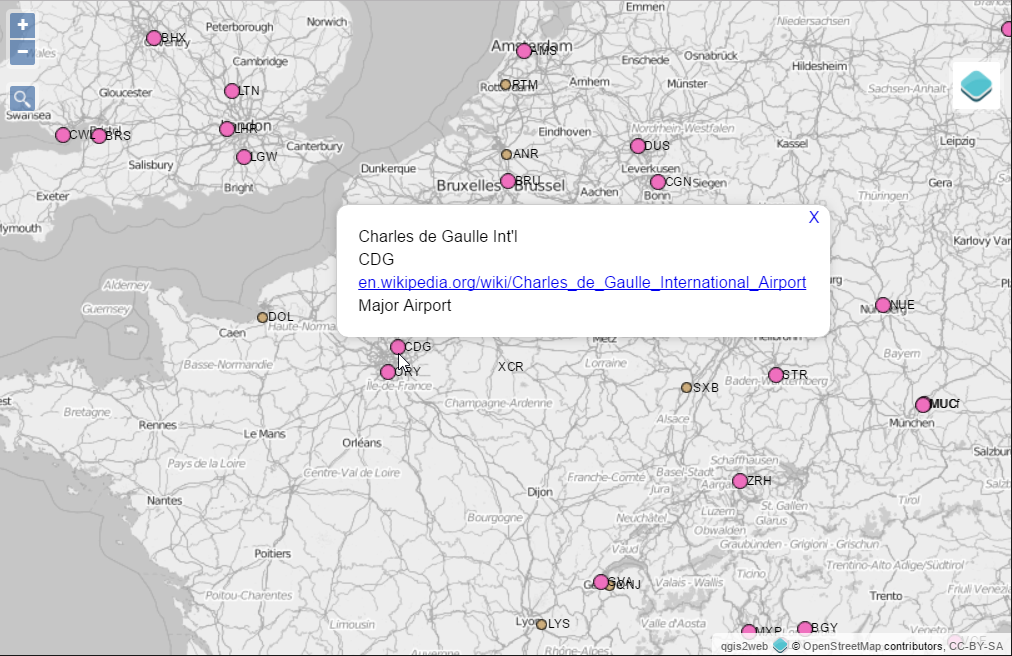
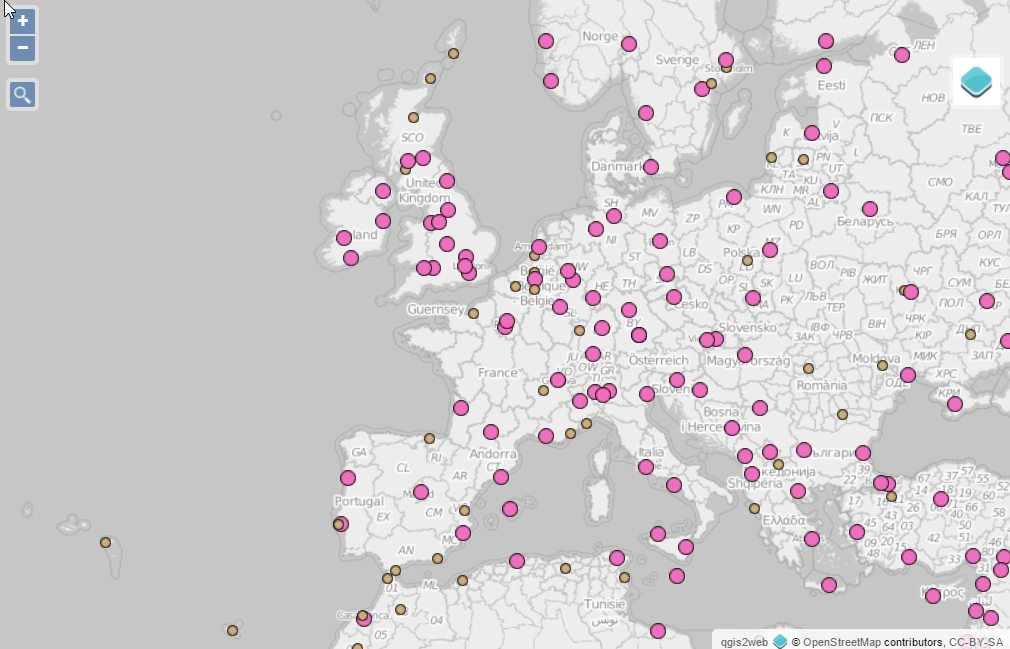
Once the export is complete, the default browser for your computer will
open and show the interactive web map.
Your web map is now ready for publishing.
The qgis2web plugin has many limitations and it cannot do everything
that the powerful web mapping libraries OpenLayers and Leaflet can
do. This process can act as the starting point in your web mapping process
and save you valuable time by creating a basic template from which you can
further customize the web map. To highlight the fact that the output
created from this process can be readily changed to suit your requirement -
we will make a simple change to the web map to zoom to a particular airport
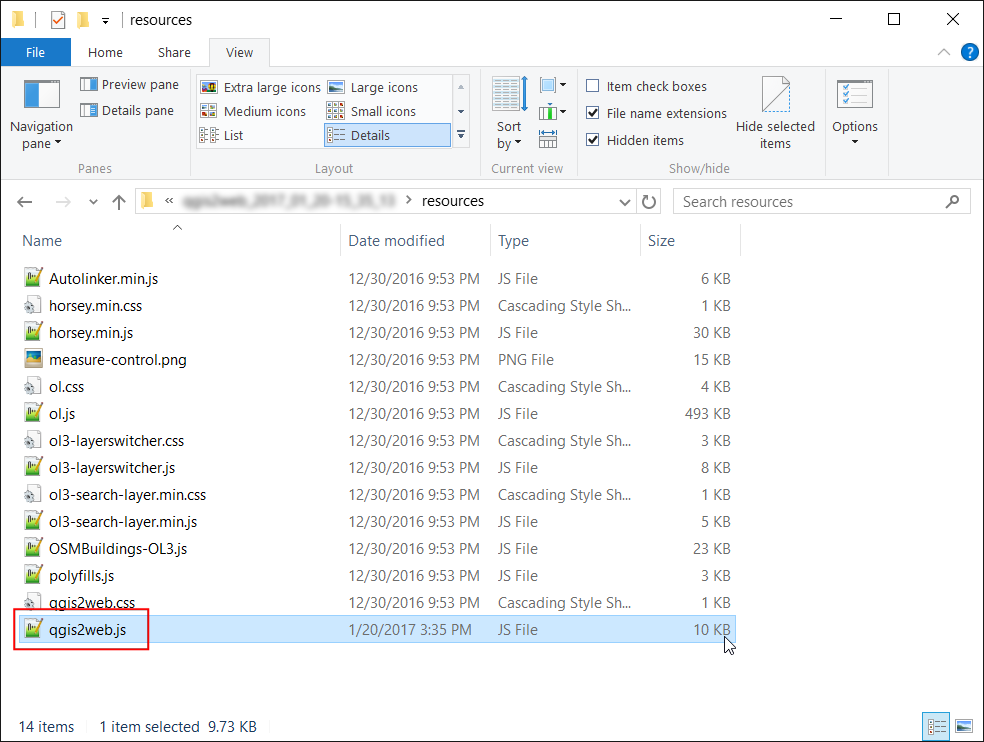
when the user initially loads the map. On your computer, go to the folder
where the web map was exported. Locate the resources folder and open
qgis2web.js file in a text editor.
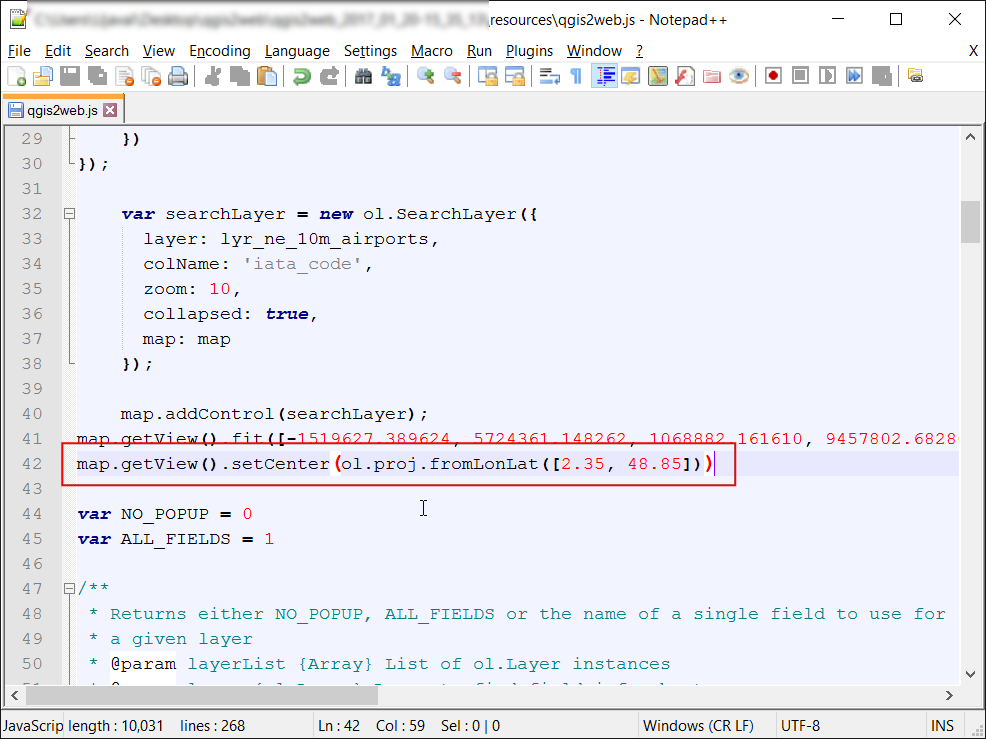
Locate the line where the map.getView().fit() function is called and
add the following code after that. This new line of code instructs the web
browser to center the map on the coordinates of Paris. Save the changes to
the qgis2web.js file.
Refresh your browser and see that the web map will load with Paris at the
center. This is a trivial example, but you can see how you can use any
function available in the OpenLayers or Leaflet libraries to
customize the web map.
The exported map resides on your computer. While you can see it in action,
it is not very useful since you cannot share it anyone. For others to be
able to see the map, you need to upload it to a web server. While the
upload process will vary on the type of server you have access to - a cheap
and easy way to publish your map on the web would be to use any of the
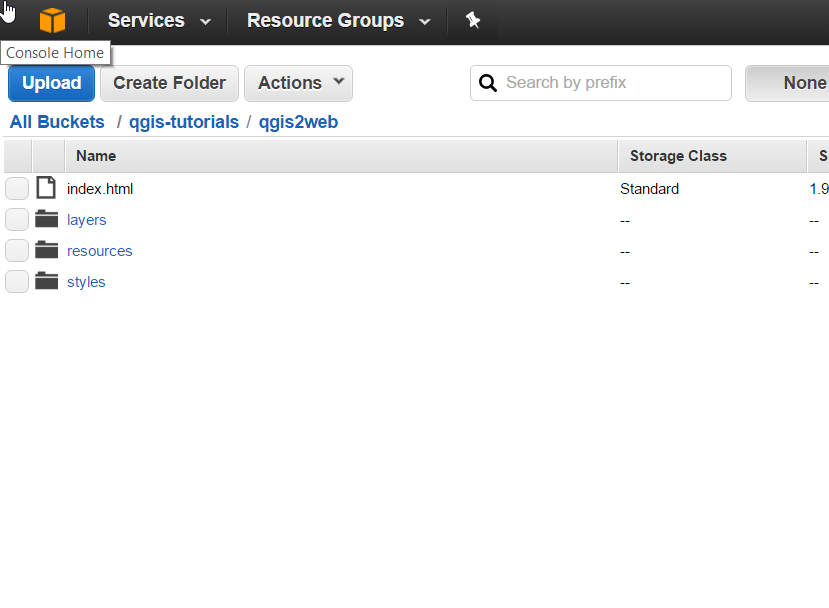
public cloud storage services. Amazon S3 is
a popular storage service. You will need to sign up for an account and
follow the instructions to create a bucket. Once a bucket is created, you
can upload the contents of your exported folder to the bucket and set it to
public. Here I created a bucket named qgis-tutorials and uploaded the
contents of my exported folder to a sub-folder named qgis2web. You can
access the resulting map at
http://s3.amazonaws.com/qgis-tutorials/qgis2web/index.html
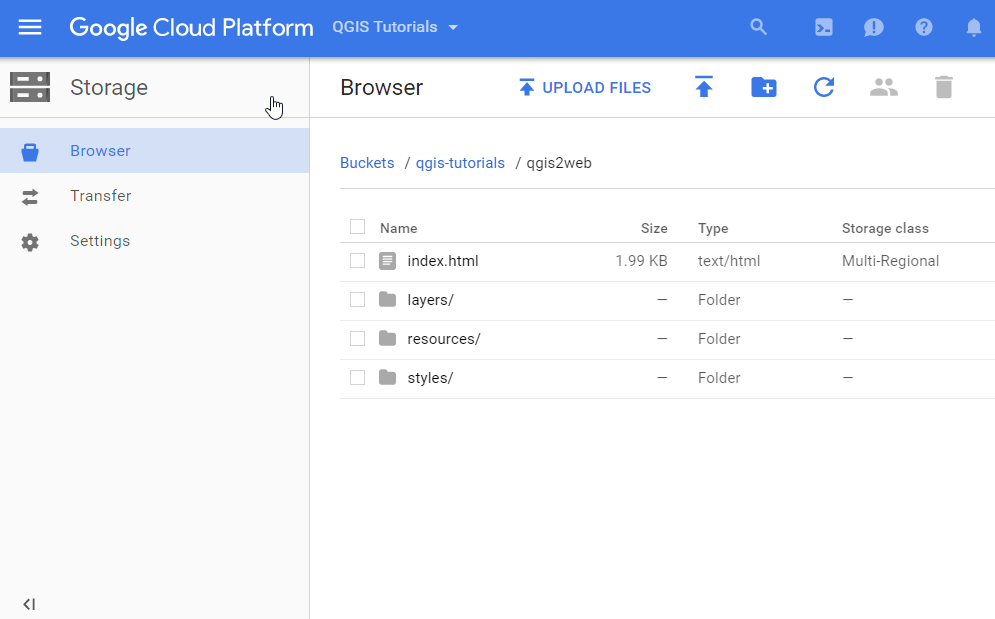
Similarly, Google also offers a cloud storage service called Google Cloud
Storage. Once you have created an
account and enable billing, you can create a bucket and upload objects to
the bucket. I create a bucket and sub-folder similar to Amazon and set the
folder to public. The resulting map can be viewed at
https://storage.googleapis.com/qgis-tutorials/qgis2web/index.html