Performing Table Joins (PyQGIS)

This tutorial shows how to use Python scripting in QGIS (PyQGIS) to perform a table join and apply a graduated style to the resulting layer. This tutorial replicates the steps of the Performing Table Joins tutorial using only python scripting.

Overview of the task

Please refer to Performing Table Joins tutorial for the overview.

Other skills you will learn

  • Loading zipped layers in QGIS via Python.
  • Using QgsGraduatedSymbolRendererV2 to apply a graduated style to a vector layer.

Get the data

Download the following files to your computer.

tl_2013_06_tract.zip

ca_tracts_pop.csv

ca_tracts_pop.csvt

Data Source [TIGER] [USCENSUS]

Procedure

You can type the following commands in the Python Console or the built-in Editor in QGIS.

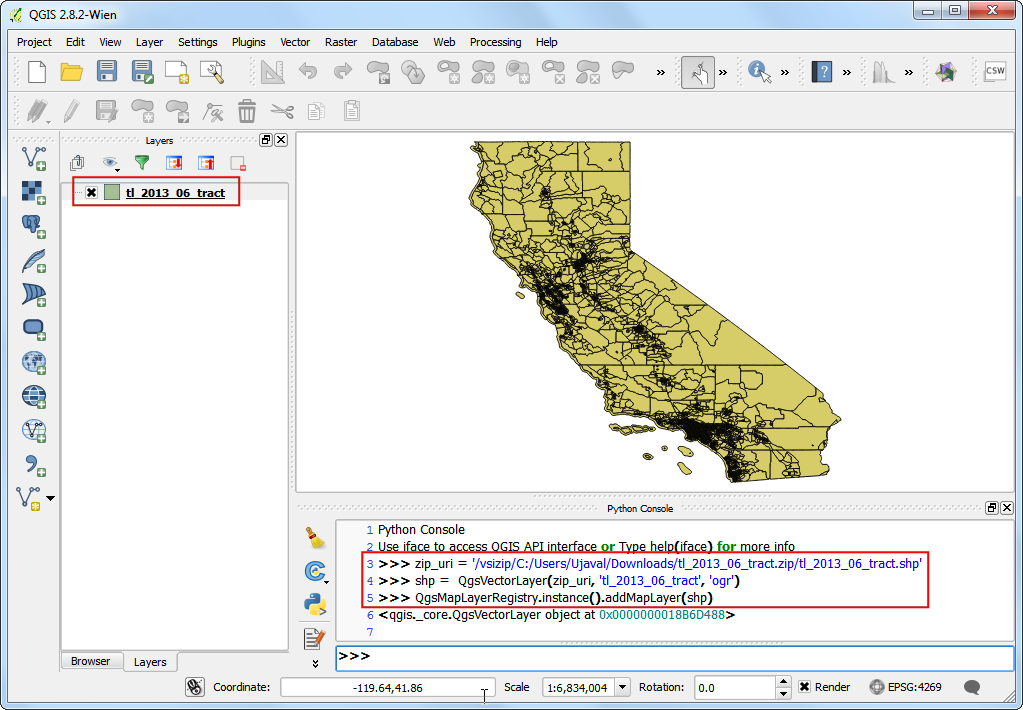
  1. Load the shapefile. The Census Tracts file is a zip file containing the shapefile. While we can unzip it and load the shapefile, The OGR provider has the ability to load the zip file directly via a Virtual Filesystem. Adding /vsizip/ in the path, we can access the shapefile contained in the zip archive.

Note

The zip_uri would begin with /vsizip// on Linux and Mac systems. (Note the extra /)

zip_uri = '/vsizip/C:/Users/Ujaval/Downloads/tl_2013_06_tract.zip'
shp =  QgsVectorLayer(zip_uri, 'tl_2013_06_tract', 'ogr')
QgsMapLayerRegistry.instance().addMapLayer(shp)
../_images/1133.png
  1. Load the CSV file. As the CSV file doesn’t contain any spatial data, we load it as a table using the delimitedtext provider.
csv_uri = 'file:///C:/Users/Ujaval/Downloads/ca_tracts_pop.csv?delimiter=,'
csv = QgsVectorLayer(csv_uri, 'ca_tracts_pop', 'delimitedtext')
QgsMapLayerRegistry.instance().addMapLayer(csv)
../_images/289.png
  1. Create the table join. Table joins in QGIS are performed using QgsVectorJoinInfo object. We need to specify the GEO.id2 field from the CSV layer as the Join Field and the GEOID field from the shapefile layer as the Target Field. Once you run the following code, the shapefile layer will have additional attributes joined from the csv layer.

Note

A common pitfall when using QgsVectorJoinInfo is that both the layers must be loaded in the QgsMapLayerRegistry - otherwise the join would not work.

shpField='GEOID'
csvField='GEO.id2'
joinObject = QgsVectorJoinInfo()
joinObject.joinLayerId = csv.id()
joinObject.joinFieldName = csvField
joinObject.targetFieldName = shpField
joinObject.memoryCache = True
shp.addJoin(joinObject)
../_images/349.png
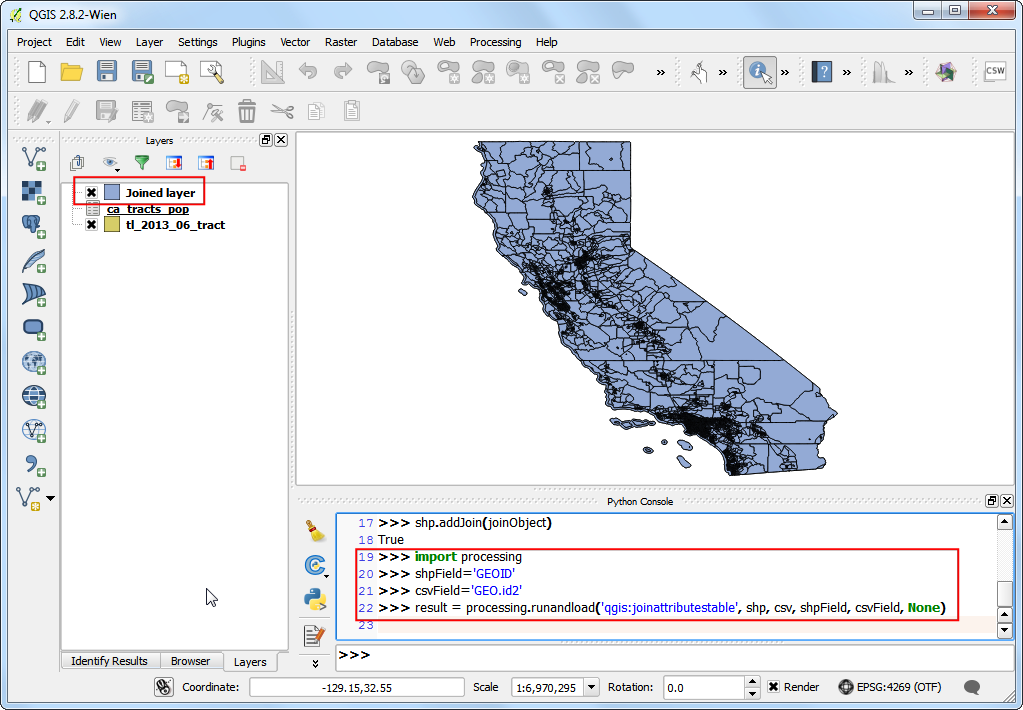
  1. An easier - and preferred way of accomplishing the same thing is via the Processing Framework. You can call the algorithm qgis:joinattributestable and create a joined layer.

Note

We are using the processing.runandload() method to execute the algorithm instead of the more common processing.runalg(). Since we want to load the resulting joined layer in QGIS, processing.runandload() is a better choice.

import processing
shpField='GEOID'
csvField='GEO.id2'
result = processing.runandload('qgis:joinattributestable', shp, csv, shpField, csvField, None)
../_images/430.png
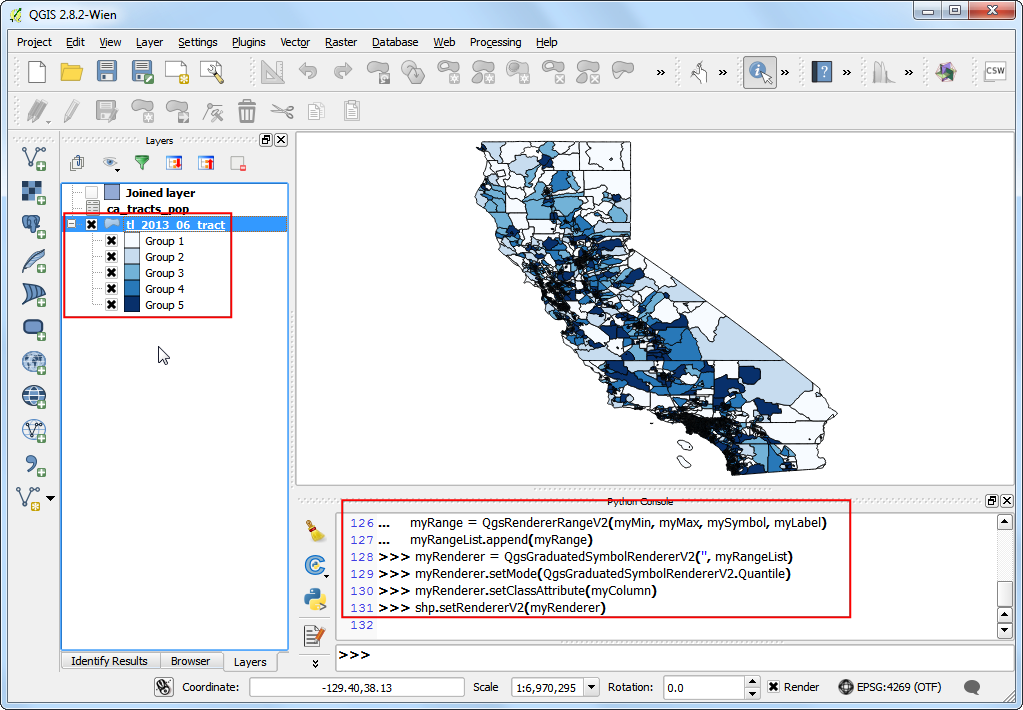
  1. We will stick with the original join using QgsVectorJoinInfo for the remainder of the tutorial. Now it is time to apply a graduated style to the joined layer. The population field name in the joined layer is ca_tracts_pop_D001. We will apply a graduated renderer using the QgsGraduatedSymbolRendererV2 class in the Quantile mode. Refer to Performing Table Joins for the colors and ranges that we need to use.
from PyQt4 import QtGui

myColumn = 'ca_tracts_pop_D001 '
myRangeList = []
myOpacity = 1

ranges = []

myMin1 = 0.0
myMax1 = 3157.2
myLabel1 = 'Group 1'
myColor1 = QtGui.QColor('#f7fbff')
ranges.append((myMin1, myMax1, myLabel1, myColor1))

myMin2 = 3157.2
myMax2 = 4019.0
myLabel2 = 'Group 2'
myColor2 = QtGui.QColor('#c7dcef')
ranges.append((myMin2, myMax2, myLabel2, myColor2))

myMin3 = 4019.0
myMax3 = 4865.8
myLabel3 = 'Group 3'
myColor3 = QtGui.QColor('#72b2d7')
ranges.append((myMin3, myMax3, myLabel3, myColor3))

myMin4 = 4865.8
myMax4 = 5996.4
myLabel4 = 'Group 4'
myColor4 = QtGui.QColor('#2878b8')
ranges.append((myMin4, myMax4, myLabel4, myColor4))

myMin5 = 5996.4
myMax5 = 37452.0
myLabel5 = 'Group 5'
myColor5 = QtGui.QColor('#08306b')
ranges.append((myMin5, myMax5, myLabel5, myColor5))

for myMin, myMax, myLabel, myColor in ranges:
  mySymbol = QgsSymbolV2.defaultSymbol(shp.geometryType())
  mySymbol.setColor(myColor)
  mySymbol.setAlpha(myOpacity)
  myRange = QgsRendererRangeV2(myMin, myMax, mySymbol, myLabel)
  myRangeList.append(myRange)

myRenderer = QgsGraduatedSymbolRendererV2('', myRangeList)
myRenderer.setMode(QgsGraduatedSymbolRendererV2.Quantile)
myRenderer.setClassAttribute(myColumn)

shp.setRendererV2(myRenderer)
../_images/531.png
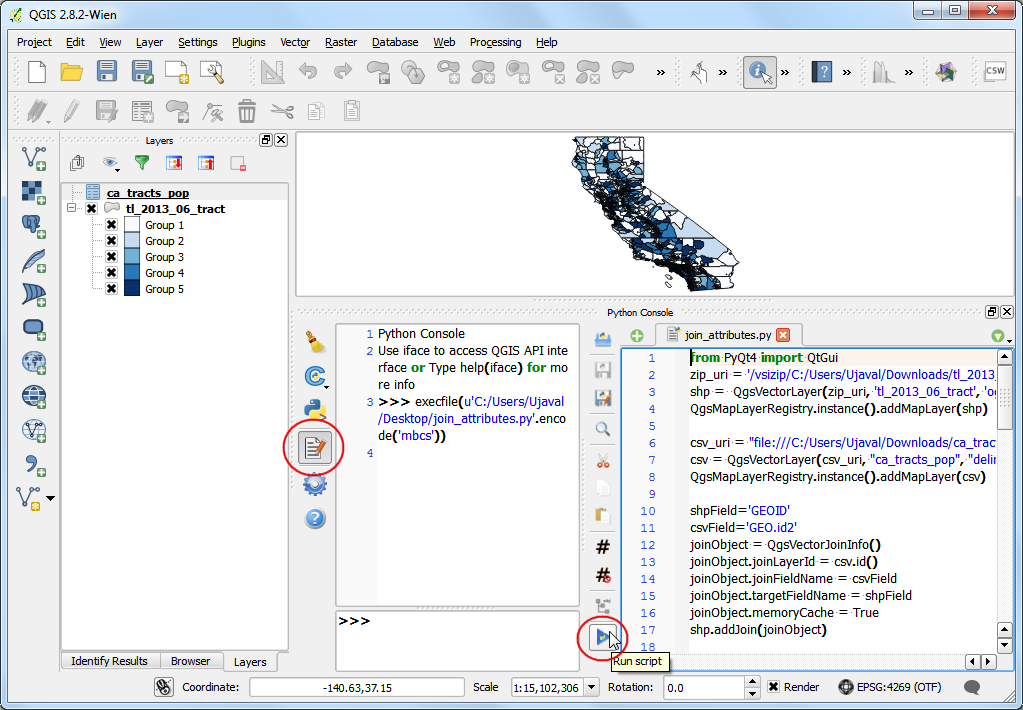
  1. Typing the code in the Python Console is useful for small tasks, but it is far easier to use the built-in Editor. You can copy the entire script in the Editor and click Run. As the script finishes, you would have created a table join and styled the resulting layer without any manual steps.
../_images/629.png

Below is the full join_attributes.py file as a reference.

from PyQt4 import QtGui
zip_uri = '/vsizip/C:/Users/Ujaval/Downloads/tl_2013_06_tract.zip/tl_2013_06_tract.shp'
shp =  QgsVectorLayer(zip_uri, 'tl_2013_06_tract', 'ogr')
QgsMapLayerRegistry.instance().addMapLayer(shp)

csv_uri = "file:///C:/Users/Ujaval/Downloads/ca_tracts_pop.csv?delimiter=,"
csv = QgsVectorLayer(csv_uri, "ca_tracts_pop", "delimitedtext")
QgsMapLayerRegistry.instance().addMapLayer(csv)

shpField='GEOID'
csvField='GEO.id2'
joinObject = QgsVectorJoinInfo()
joinObject.joinLayerId = csv.id()
joinObject.joinFieldName = csvField
joinObject.targetFieldName = shpField
joinObject.memoryCache = True
shp.addJoin(joinObject)

myColumn = 'ca_tracts_pop_D001 '
myRangeList = []
myOpacity = 1

ranges = []

myMin1 = 0.0
myMax1 = 3157.2
myLabel1 = 'Group 1'
myColor1 = QtGui.QColor('#f7fbff')
ranges.append((myMin1, myMax1, myLabel1, myColor1))

myMin2 = 3157.2
myMax2 = 4019.0
myLabel2 = 'Group 2'
myColor2 = QtGui.QColor('#c7dcef')
ranges.append((myMin2, myMax2, myLabel2, myColor2))

myMin3 = 4019.0
myMax3 = 4865.8
myLabel3 = 'Group 3'
myColor3 = QtGui.QColor('#72b2d7')
ranges.append((myMin3, myMax3, myLabel3, myColor3))

myMin4 = 4865.8
myMax4 = 5996.4
myLabel4 = 'Group 4'
myColor4 = QtGui.QColor('#2878b8')
ranges.append((myMin4, myMax4, myLabel4, myColor4))

myMin5 = 5996.4
myMax5 = 37452.0
myLabel5 = 'Group 5'
myColor5 = QtGui.QColor('#08306b')
ranges.append((myMin5, myMax5, myLabel5, myColor5))

for myMin, myMax, myLabel, myColor in ranges:
    mySymbol = QgsSymbolV2.defaultSymbol(shp.geometryType())
    mySymbol.setColor(myColor)
    mySymbol.setAlpha(myOpacity)
    myRange = QgsRendererRangeV2(myMin, myMax, mySymbol, myLabel)
    myRangeList.append(myRange)

myRenderer = QgsGraduatedSymbolRendererV2('', myRangeList)
myRenderer.setMode(QgsGraduatedSymbolRendererV2.Quantile)
myRenderer.setClassAttribute(myColumn)

shp.setRendererV2(myRenderer)
comments powered by Disqus

This work is licensed under a Creative Commons Attribution 4.0 International License